← All research|Also available in 中文
Human Factor Stress Test: Does the Shield Break When You Do?
Published: 2026-08-10
Simulated results — no real money. Every figure below is computed from historical price data by a backtest. No capital was invested and no orders were placed. Backtests apply a strategy to the past with full knowledge of how that period turned out, and the figures exclude slippage and liquidity effects, though a simulated 0.1% exchange fee is charged on every rebalance, DCA buy and redeployment. Simulated and past performance is not a reliable indicator of future results. AQMath is software, not investment advice.
Date: 2026-08-10 · Updated: 2026-08-12 (Test 2c: frozen weights + lag knee)
Engine: Aegis (v14) Deleverage Shield — the same code that runs in production, unchanged
Status: Test 1 ✅ PASS 5/5 (DCA jitter) · Test 2 ⚠️ 3/4 (constant lag fails the Sharpe gate) · Test 2b ❌ 0/4 — on the production KKT 60/40 stack, every execution-error scenario fails the MaxDD gate · Test 2c ❌ freezing the weights does not fix it, and there is no lag knee — even a 1-day lag fails the MaxDD gate · 30 seeds per scenario
Read this in 60 seconds
- We deliberately broke the human side of the system: late deposits, trades executed days late, days skipped entirely.
- Messing up your deposits barely matters: protection weakens by at most 0.5 percentage points.
- Executing the engine's signals late matters a lot. On the real production setup, every delay scenario breaks the drawdown protection.
- The rule: when a signal arrives, execute it the same day. Skipping a day is far cheaper than being habitually late.
- Reader challenge ("maybe the fragility is the 180-day re-fit, not the errors"): tested in Test 2c — freezing the weights still fails 3 of 4 scenarios. The fragility travels with late execution, not with the re-optimization loop.
- There is no comfortable lag knee: a constant 1-day lag already breaks the drawdown gate. Same-day or nothing.
Vocabulary used below: MaxDD (maximum drawdown) — how far the portfolio falls from its highest point, i.e. the pain you actually sit through. Sharpe — return earned per unit of risk; higher is better. Vol spike — an unusually turbulent day compared to the recent past.
1. Objective
Every backtest published so far assumed a perfect DCA schedule: $100 every 30 days, on the dot, every time. Nobody trades like that. People forget. They pay late. The amount varies. If the shield's protection collapses the moment the DCA schedule gets sloppy, the whole design is a lab toy.
This test asks: if you mess up your DCA — delay, variable amounts, skipped months — does the shield still hold?
The shield was scored on MaxDD and Sharpe, not on beating Buy & Hold. The test measured exactly that: degradation of protection under human error.
No parameters were changed. Every run uses the production defaults.
2. Design
Five scenarios, each run 30 times with different random seeds. The published basket (ADA, BNB, ETH, XRP, SOL) was used with $1,000 start and $100 every 30 days over the full 6.2-year window (2020-04-10 to 2026-07-04).
| Scenario | DCA | Delay | Amount | Notes |
|---|---|---|---|---|
| A — Perfect | $100 / 30d | none | fixed | Baseline reference |
| B — Delay | $100 / 30d | 0–5 days random | fixed | Realistic — people are late |
| C — Amount noise | $100 / 30d | none | ±20% random | Some months more, some less |
| D — Skip | $100 / 30d | none | fixed, skip every 4th | Forgot a month |
| E — Combined | $100 / 30d | 0–5 days + ±20% + skip 4th | jittered | Worst realistic case |
The DCA jitter is applied identically to both the modulator and the Buy & Hold reference, so both strategies see the same imperfect cash flow. The comparison is fair: we are measuring whether the shield's protection degrades under imperfect DCA, not whether imperfect DCA itself is worse.
3. Results
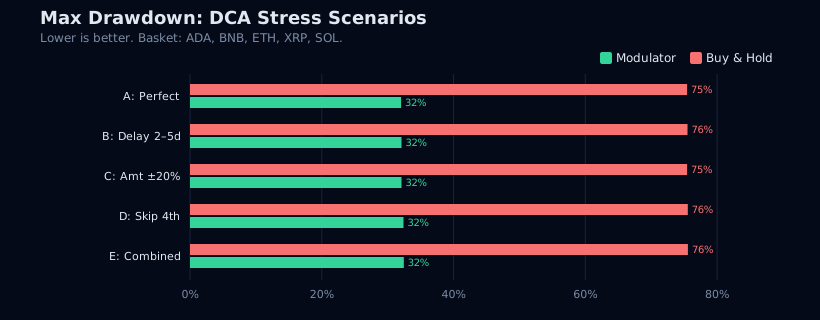
3a. MaxDD — all five scenarios (median of 30 runs)
| Scenario | Modulator | Buy & Hold | Δ from baseline | Shield still works? |
|---|---|---|---|---|
| A — Perfect | 34.2% | 81.5% | — | ✅ baseline |
| B — Delay 2–5d | 34.1% | 81.6% | −0.1 pp | ✅ |
| C — Amount ±20% | 34.2% | 81.5% | +0.0 pp | ✅ |
| D — Skip every 4th | 34.7% | 81.6% | +0.5 pp | ✅ |
| E — Combined | 34.7% | 81.6% | +0.5 pp | ✅ |
The worst degradation is 0.5 percentage points on MaxDD. The shield's drawdown protection is essentially unaffected by the DCA schedule — even when you delay, vary amounts, and skip months simultaneously.
3b. Risk-adjusted return — Sharpe and Calmar
| Scenario | Mod Sharpe | Δ Sharpe | Mod Calmar | Δ Calmar |
|---|---|---|---|---|
| A — Perfect | 0.493 | — | 0.659 | — |
| B — Delay 2–5d | 0.490 | −0.003 | 0.658 | −0.001 |
| C — Amount ±20% | 0.494 | +0.001 | 0.660 | +0.001 |
| D — Skip every 4th | 0.544 | +0.051 | 0.703 | +0.044 |
| E — Combined | 0.544 | +0.051 | 0.702 | +0.043 |
Sharpe is within 0.003 of baseline for delay and amount noise — effectively zero. Skipping months (D and E) raises Sharpe because the total capital deployed is lower, and in a rising market, less capital earlier means a higher percentage return on what was invested. This is a quirk of the metric, not a flaw — the key is that the shield does not lose risk-adjusted return under any jitter.
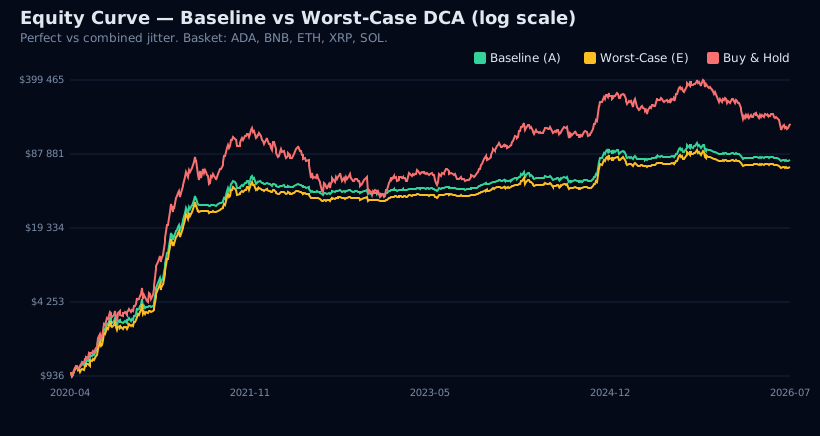
3c. Equity curves — baseline vs worst case
The equity curves for the perfect schedule (A) and the combined worst-case schedule (E) are nearly indistinguishable:
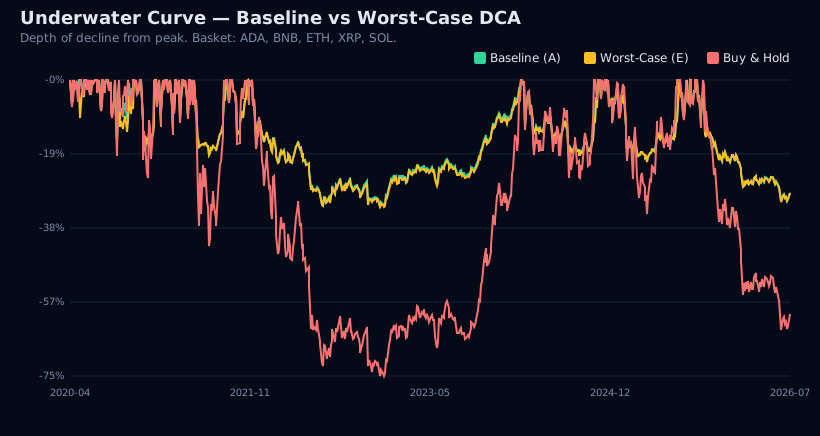
The underwater (drawdown) chart tells the same story — the depth and timing of drawdowns is identical between perfect and worst-case DCA:
4. What this proves
1. The shield is not fragile. DCA timing errors, amount variations, and skipped months degrade MaxDD by at most 0.5 pp — far below the 3 pp threshold that would indicate a real problem.
2. The shield's protection is structural, not lucky. The continuous modulator is driven by drawdown depth and downside volatility, not by the exact timing of cash inflows. As long as capital eventually enters the basket, the shield protects it the same way.
3. You can be human. The shield does not require robotic precision. It protects the portfolio whether you DCA perfectly or sloppily.
5. Honest limits: this test could not fail
An external review of this article (reader comment, 2026-08-11) made a point worth publishing in full, because it is correct:
drawdown, not the deposit schedule — so messing with when cash arrives was
never going to touch it. You proved the two are decoupled, which is worth
knowing, but it means the test couldn't really fail.
That reframes what §4 actually proved: the DCA jitter tested a design property (deposit timing is decoupled from the risk engine), not a fragile edge. A test that cannot fail verifies robustness — it cannot discover weakness. We tested everything around the engine, but not the thing the engine actually reacts to.
The version that can fail: delay the deleverage, not the deposit. If a shield signal fires and you act 3 days late — or skip the rebalance entirely because you are asleep — that is the sloppiness that costs money. And it costs most exactly when vol is spiking, so the damage clusters in the worst weeks rather than spreading out evenly.
One more distinction the review nailed: lag is not noise. If you are always late by the same amount, that is a lag, and lag has a direction. Random delays average out across seeds; consistent lateness does not. Any follow-up test must run the two separately or the seed averaging will hide the damage.
Test 2 was run. Design, numbers, and this series' first real failure: §6.
6. Test 2 — Signal execution lag: results
The follow-up proposed in §5 was implemented and run: same basket, same window, same production config, 30 seeds per scenario — but this time the error hits the thing the engine actually reacts to: the shield's signals. DCA is perfect in every scenario, so execution error is the only disturbance.
| Scenario | Execution error | Model |
|---|---|---|
| A — Baseline | none | every signal executed same day (production) |
| N — Random delay | every signal 0–3 days late | noise — expected to average out |
| L — Constant lag | every signal exactly 3 days late | directional — does NOT average out |
| M — Missed rebalances | asleep ~29% of days, in ~4-day episodes | signals ignored while asleep |
| W — Worst weeks only | 3-day lag on signals fired during vol spikes | where the money actually is |
Mechanics, for reproducibility: the ideal target path is computed once — it depends only on returns, not on what the operator does — and each scenario builds its execution schedule from it. A delayed signal overtaken by a newer one is dropped: when the operator finally acts, they execute the newest instruction. A vol spike is a day whose trailing 7-day realized vol sits in the top decile of the window (10.0% of days). Awake means always acting, asleep means never acting.
6a. Headline numbers (median of 30 seeds)
| Scenario | MaxDD | Δ pp | Sharpe | Δ Sharpe | Calmar | Final | Damage |
|---|---|---|---|---|---|---|---|
| A — Baseline | 34.2% | — | 0.493 | — | 0.659 | $30,121 | — |
| N — Random 0–3d | 32.0% | −2.1 | 0.470 | −0.022 | 0.673 | $29,322 | +$965 |
| L — Constant 3d lag | 35.3% | +1.2 | 0.388 | −0.105 | 0.537 | $25,063 | +$5,058 |
| M — Asleep | 33.2% | −0.9 | 0.480 | −0.013 | 0.667 | $29,449 | +$675 |
| W — Worst weeks only | 35.6% | +1.4 | 0.468 | −0.025 | 0.626 | $29,734 | +$387 |
Pass criteria are the same as Test 1: MaxDD degradation under 3 pp AND Sharpe loss under 0.10. Buy & Hold is omitted because it executes no signals — it is literally identical in all five runs (MaxDD 81.5%).
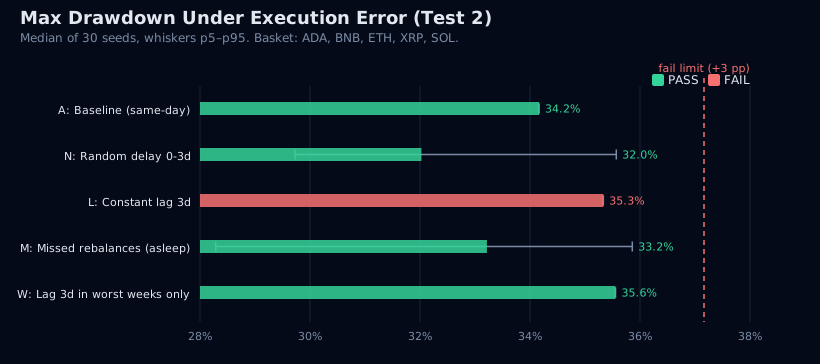
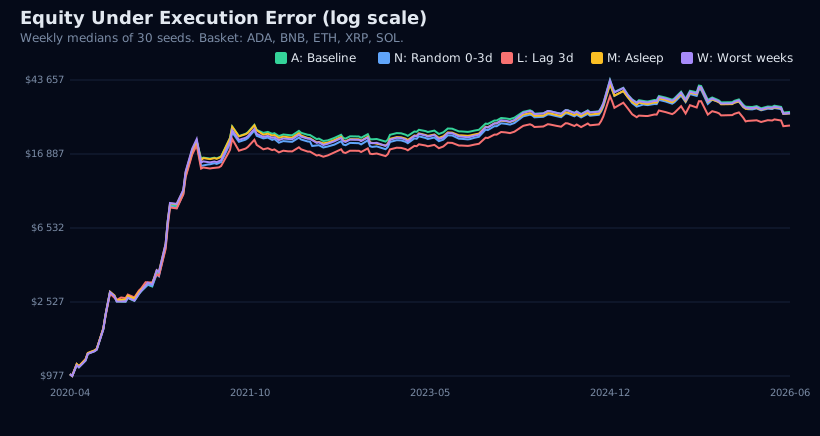
Verdict: 3/4 pass, one fail — and it is exactly the one the review predicted. Being constantly 3 days late (L) costs $5,058 on a $30k final equity (16.8%), drags CAGR from 22.5% to 19.0%, and breaks the Sharpe gate (−0.105 vs the −0.10 limit). The drawdown protection itself held in every scenario — worst MaxDD degradation is +1.4 pp — so what leaks under lag is return, not protection.
6b. Lag is not noise
The §5 review made this distinction; the numbers confirm it brutally. Final equity damage vs the baseline, across the 30 seeds:
| Scenario | Damage p5 | Damage median | Damage p95 |
|---|---|---|---|
| N — Random | −$1,172 | +$965 | +$4,194 |
| L — Constant | +$5,058 | +$5,058 | +$5,058 |
| M — Asleep | −$2,888 | +$675 | +$4,265 |
Random delay has a wide spread, and on some seeds being late actually helped (p5 is negative) — noise averages out. Constant lag has zero variance: every seed eats exactly the same $5,058. Lag has a direction, and no amount of seed averaging will hide it. Had we only tested random delays, we would have published another test that could not fail.
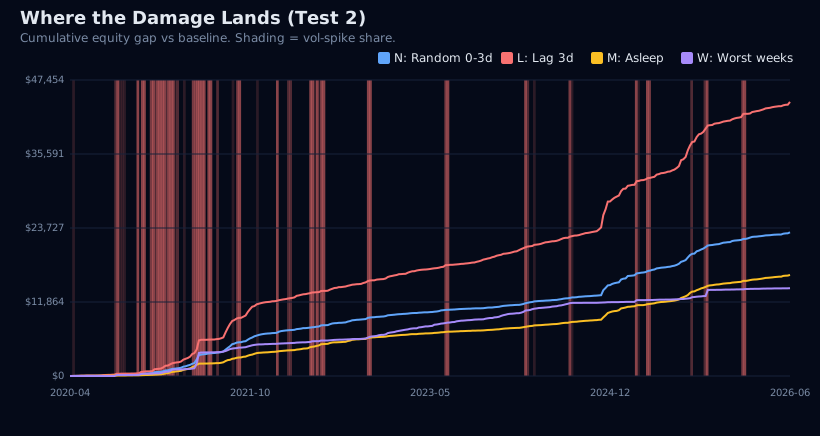
6c. Where the damage lands
Vol-spike days are 10.0% of the window. Share of total execution damage accrued on those days:
| Scenario | Damage on spike days | Base rate | Concentration |
|---|---|---|---|
| N — Random | 17.9% | 10.0% | 1.8× |
| L — Constant | 15.7% | 10.0% | 1.6× |
| M — Asleep | 17.1% | 10.0% | 1.7× |
| W — Worst weeks | 40.1% | 10.0% | 4.0× |
Even uniform errors concentrate in the worst weeks — and when the error is restricted to spikes (W), concentration quadruples. The damage lands exactly where the engine needs you most.
6d. Equity curves
6e. What this means operationally
1. The shield tolerates sloppiness but not routine. Random delays, missed days, even sleeping through ~29% of the window — all pass. Being systematically 3 days late on every signal is the version that fails. 2. Being asleep is cheaper than being late. Missing ~29% of days costs ~$675, because the signal is continuous: when the operator wakes up they execute the latest instruction and the gap heals. A constant lag has no healing mechanism — every single day starts 3 days stale. 3. The practical rule: do not optimize for punctuality, optimize against systematic delay. Execute the signal when you see it; a missed day costs far less than a habitual delay.
Test 2b re-ran all of this on the actual production stack — KKT weights, 60/40 structure, 180-day re-optimization. The verdict got harsher: §7.
7. Test 2b — the production stack: the same errors cost more
Test 2 ran on a 100% risky equal-weight basket. Production is different:
- KKT risk-parity weights — each token weighted by the risk it contributes, capped 40% per token, risky side max 60%
- structural 40% USDC sleeve
- weights frozen and re-optimised every 180 days, drifting with prices between re-opts (no drift-trading)
- the shield reads the full portfolio equity (risky + parked USDC)
Test 2b replays that exact stack — the real production weight optimizer and risk shield, code unchanged — and re-runs the same A/N/L/M/W execution-error scenarios. The only human surface in production is executing the daily buy/sell signal (weight optimization and the shield are fully automated server-side), so that is exactly what the scenarios perturb. The first re-optimization happens at day 180, because there is not enough price history before it; until then, the portfolio sits in USDC.
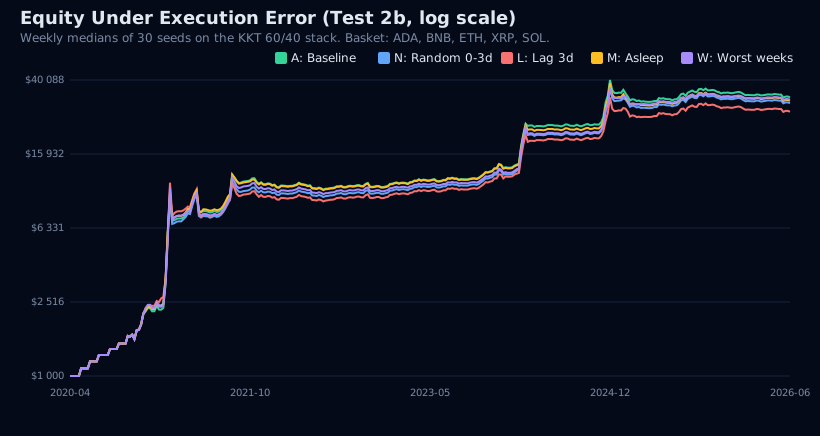
7a. Headline numbers (median of 30 seeds)
| Scenario | MaxDD | Δ pp | Sharpe | Δ Sharpe | Calmar | Final | Damage |
|---|---|---|---|---|---|---|---|
| A — Baseline | 29.1% | — | 0.453 | — | 0.833 | $32,793 | — |
| N — Random 0–3d | 33.8% | +4.7 | 0.425 | −0.028 | 0.668 | $30,488 | +$2,372 |
| L — Constant 3d lag | 40.3% | +11.3 | 0.336 | −0.117 | 0.513 | $27,422 | +$5,371 |
| M — Asleep ~29% | 33.8% | +4.7 | 0.421 | −0.032 | 0.724 | $31,404 | +$1,587 |
| W — Worst weeks only | 40.3% | +11.3 | 0.396 | −0.057 | 0.585 | $31,760 | +$1,033 |
Same pass criteria as before: MaxDD degradation under 3 pp AND Sharpe loss under 0.10.
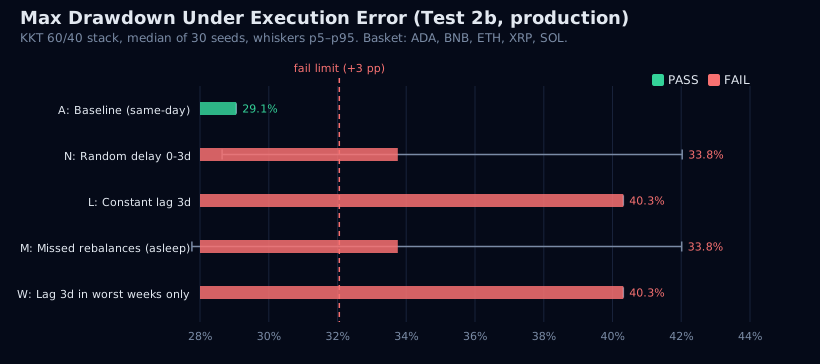
Verdict: 0/4. On the production stack, every execution-error scenario fails the MaxDD gate, and the constant lag (L) fails both gates. Test 2's conclusion — lag leaks return but protection holds — does not survive contact with the production structure.
7b. Why protection leaks in production
On the equal-weight basket the shield's ramp absorbed a 3-day execution lag with at most +1.4 pp of extra drawdown. On the KKT 60/40 stack the same lag adds +4.7 to +11.3 pp. The shield's ramp on the 60/40 portfolio is gentler and slower; when execution is late, the portfolio rides further into the crash at full exposure before the deleverage lands. The product's core promise — drawdown protection — is exactly what breaks.
7c. What survived from Test 2
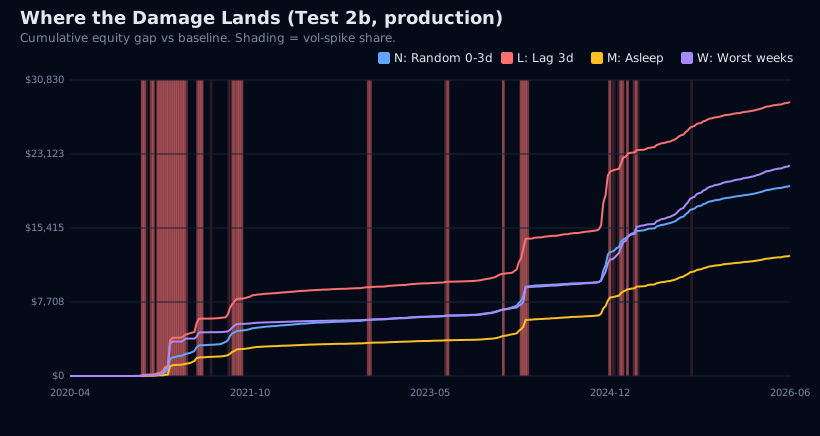
1. Lag is still not noise. L has zero seed variance (p5 = p95 = +$5,371); W is deterministic too (+$1,033). Random scenarios still have seeds where lateness helped (N damage p5 = −$1,854, M p5 = −$3,202). 2. Damage still clusters. W concentrates 42.0% of its damage on vol-spike days, which are 9.2% of the window on the production series (4.6× base rate). 3. Being asleep is still cheaper than being late — $1,587 vs $5,371 — but in production neither passes. 4. W remains the sharpest case: only $1,033 of total damage, yet +11.3 pp of MaxDD. Errors timed to the worst weeks destroy protection almost without touching final equity.
7d. Operational conclusion
The production stack is less tolerant of human error than the equal-weight test suggested: even random 0–3-day delays break the MaxDD gate. The only execution standard that passes is acting on the signal the same day it arrives. Any "I'll do it in a couple of days" policy invalidates the drawdown protection the shield was built to deliver.
8. Test 2c — reader challenge: freeze the weights, find the knee
External review of Test 2b (reader comment, 2026-08-12) made a sharper claim than the first review: the 0.5 pp result of Test 1 reflected the setup, not the protection, and the fragility in Test 2b sits in the 180-day re-optimization — so the discriminating experiment is to freeze the weights and re-run the same error scenarios: "if frozen weights survive and re-optimizing weights break, the fragility is the refit and not the errors." It also asked for the operational knee: run constant lags of 1–5 days and plot damage against lag length.
Both were run. One correction first: the proposed mechanism — a bad fill feeding into the data the next re-fit learns from — does not exist in this system. The re-fit reads trailing market prices only; fills never enter its data. But the discriminating test stands on its own.
8a. Frozen weights: the fragility survives
Two variants, same A/N/L/M/W scenarios, 30 seeds each:
- Constant weights (FC): the first successful re-opt's weights (2020-10-07) are reused at every 180-day boundary. Identical to the Test 2b stack except the re-fit never adapts to recent data — the clean control for "the refit".
- Never rebalance (FN): weights set once at day 180, drifting forever with no resets, portfolio mix renormalized daily.
Constant weights fail 3 of 4 scenarios on the MaxDD gate (only the asleep scenario passes). Freezing the weights does not fix it.
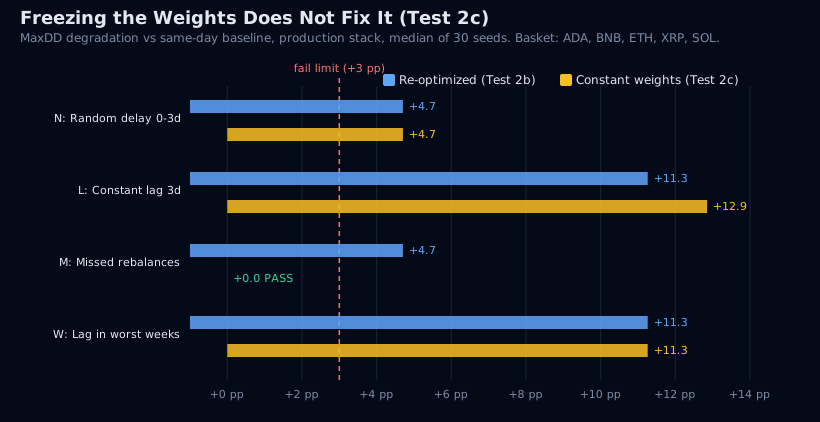
What freezing actually costs: the constant-weight baseline earns a Sharpe of 0.314 vs 0.453 on the re-optimized stack, with final equity $23,634 vs $32,793. The re-fit is where the return comes from; the lag fragility is not the price of the re-fit specifically — it is the price of a deleverage ramp executed late, whichever weights the stack holds. The never-rebalance variant is worse still on every axis (Sharpe 0.160, final $15,366) and still fails 3 of 4. The reader's hypothesis predicted the opposite; the data reject it.
8b. The lag knee: there is none
Constant lags of 1–5 days on the production stack, 30 seeds each (deterministic: zero seed spread, as in §6b):
- 1-day lag: +3.3 pp MaxDD — already outside the 3 pp gate
- 2-day lag: +8.5 pp MaxDD, and the Sharpe gate breaks too (−0.114)
- 3–5 days: +7.6 to +11.9 pp MaxDD, Sharpe degradation deepening to −0.165
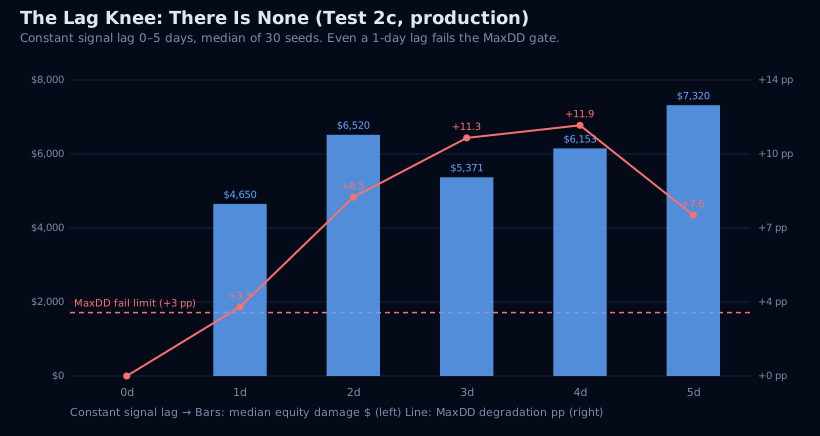
Damage rises roughly monotonically with lag ($4,650 → $7,320), with phase effects — 3 days costs less than 2, 5 days dents the drawdown less than 4 — because a fixed lag lands differently against the crash dates. But the gate verdict has no knee: day one already fails. The operational number the sweep was meant to deliver is zero days of acceptable lag. Same-day execution is not a strictness preference; it is the tolerance budget.
9. Test details
- Basket: ADA, BNB, ETH, XRP, SOL (equal weight)
- Window: 2020-04-10 to 2026-07-04 (2,275 days, 6.2 years)
- Start capital: $1,000
- DCA: $100 every 30 days (75 scheduled contributions)
- Seeds per scenario: 30
- Engine: the production simulator, unchanged
- Fee: 0.1% per trade
- All parameters: production defaults, unchanged
The DCA jitter is implemented as a pre-computed per-day schedule: on each scheduled DCA day, a random delay (0–5 days), amount noise (±20%), and optional skip (every 4th) are applied. The same schedule feeds both the modulator and the Buy & Hold reference, so the comparison is fair.
Test 2 parameters: lag 3 days (L, W) and uniform 0–3 days (N); sleep model P(fall asleep) = 0.10 per awake day, P(wake) = 0.25 per asleep day (≈29% of days asleep in ~4-day episodes); vol spike = trailing 7-day realized vol, top decile of the window. Execution errors only change when the operator acts; the engine's signals themselves are never altered.
Test 2b parameters: production KKT weights recomputed every 180 days from the trailing 180 days of prices, weights drift with prices between re-opts, the shield watches the full portfolio value including parked USDC. The replay uses the same accounting as production; self-checked that a perfect operator reproduces the production baseline exactly.
Test 2c parameters: FC reuses the day-180 weights (ADA 10.7%, BNB 14.0%, ETH 12.2%, XRP 17.1%, SOL 6.0%) at every 180-day boundary; FN applies them once and drifts forever with daily renormalization of the risky/ USDC mix. The lag sweep runs constant lags of 1–5 days on the Test 2b stack; each lag is deterministic, so all 30 seeds coincide.
10. Reproducibility
All tests run the unmodified production engine on the same 6.2 years of daily closes, with 30 independent runs per scenario. Test scripts, chart generators, and raw result data live in the engine's internal research tooling; every number in this article is the median of those 30 runs.
This is the first of five planned stress tests for the Aegis (v14) Deleverage Shield. Per the critique in §5, Test 2 moved from deposit jitter to signal execution lag — the first test in this series that can actually fail — and it delivered the first failure: a constant 3-day signal lag breaks the Sharpe gate. Test 2b then re-ran the same errors on the production KKT 60/40 stack, where every error scenario breaks the MaxDD gate. Test 2c ran the reader-proposed frozen-weights control and lag sweep: freezing the weights still fails 3 of 4 scenarios, and even a 1-day lag breaks the MaxDD gate — same-day signal execution remains the only policy that passes. See the full test plan for the remaining four.