← All research|Also available in 中文
Three-Basket Historical Comparison — Aegis (v14) Dual-Speed Engine (KKT MACRO Loop + Deleverage Shield)
Published: 2026-08-05
Simulated results — no real money. Every figure below is computed from historical price data by a backtest. No capital was invested and no orders were placed. Backtests apply a strategy to the past with full knowledge of how that period turned out, and the figures exclude slippage and liquidity effects, though a simulated 0.1% exchange fee is charged on every rebalance, DCA buy and redeployment. Simulated and past performance is not a reliable indicator of future results. AQMath is software, not investment advice.
Date: 2026-08-05
Engine: Dual-Speed E2E — identical wiring to the live paper trading service (180-day KKT risk-parity MACRO loop + Aegis (v14) Deleverage Shield)
Status: 📊 RESEARCH — basket comparison, no basket promoted
1. Objective
Build three structurally different baskets from a 17-token pool of daily price history (2013-2026) and find out which one has historically produced the best results under the exact shipped production stack: the 180-day KKT risk-parity MACRO loop for base weights and the Aegis (v14) Deleverage Shield for daily exposure control.
No parameters were changed. Every run uses production default_config() and the unmodified production code path — walk-forward, no lookahead.
2. Baskets and data
| Basket | Tokens | Thesis | Window limit |
|---|---|---|---|
| K1 Majors + Gold | BTC, ETH, BNB, SOL, XRP + PAXG | blue-chip core with a gold anchor | SOL (since 2020-04) |
| K2 Veterans + Gold | ADA, LINK, XMR, QNT, BCH + PAXG | 2017/18 cycle survivors + privacy + gold | PAXG (since 2019-09) |
| K3 New Gen | SUI, TIA, PYTH, ONDO, HYPE, PEAQ | newest-generation alts | HYPE (since 2024-11) |
| USDC | Shield parking asset | defensive cash, unchanged | — |
Settings: start $1,000, DCA $100 every 30 days, 10 bps simulated fee on every trade, 180-day optimizer warm-up, MACRO re-optimisation every 180 days.
Each basket was tested twice:
- Full history — each basket on its own longest possible window (which basket is historically best on its own turf).
- Shared window — all three on the same calendar window from 2025-05-28 (limited by the newest token, HYPE) → the apples-to-apples comparison.
3. Headline result — shared window (apples-to-apples)
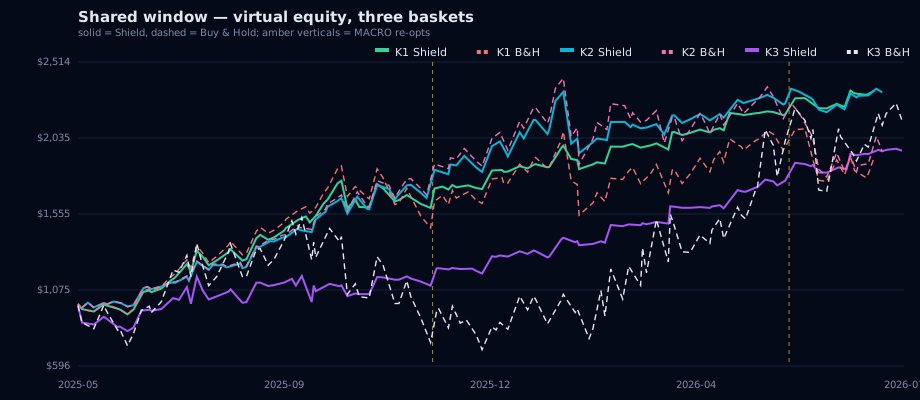
All three baskets, identical calendar window 2025-05-28 → 2026-07 (≈400-420 trading days), identical $2,300 invested.
| Metric | K1 Majors+Gold | K2 Veterans+Gold | K3 New Gen |
|---|---|---|---|
| Final value (Shield) | $2,334 | $2,323 | $1,956 |
| Final value (Buy & Hold) | $1,914 | $1,951 | $2,153 |
| CAGR (Shield / B&H) | +1.3% / −15.3% | +0.9% / −13.7% | −13.2% / −5.6% |
| Sharpe (rf 5%) | −0.13 | −0.14 | −0.51 |
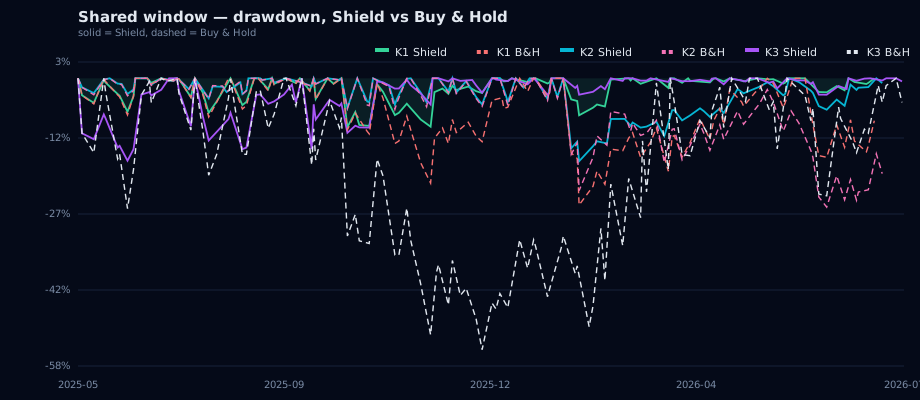
| Max drawdown (Shield / B&H) | 9.8% / 25.4% | 16.6% / 25.8% | 18.4% / 54.4% |
| Alpha (ann., Jensen) | +9.27 pp | +9.77 pp | −33.97 pp |
| Beta vs B&H | 0.46 | 0.58 | 0.15 |
| Defensive days | 239 (59%) | 142 (35%) | 360 (86%) |
| Avg risky exposure | 47.0% | 64.4% | 22.4% |
| Trading fees | $3.32 | $5.27 | $6.15 |
Reading: the shared window was a down market for crypto (Buy & Hold lost 13-17% on the two established baskets and 54% peak drawdown on the new-gen mix). In that regime K1 Majors+Gold is the winner: highest final value, lowest max drawdown (9.8%, −15.6 pp vs its own B&H), positive Jensen alpha. K2 is nearly tied on return with a somewhat deeper drawdown. K3 trailed even its own Buy & Hold on return — the 2025-26 window was hostile to the newest-generation alts — although the Shield still cut its max drawdown by 36 pp (18.4% vs 54.4%).
4. Full-history runs
Each basket on its own longest window (warm-up included, walk-forward).
| Basket | Window | Days | Final (Shield / B&H) | CAGR | Sharpe | MaxDD (S / BH) | Calmar (S / BH) |
|---|---|---|---|---|---|---|---|
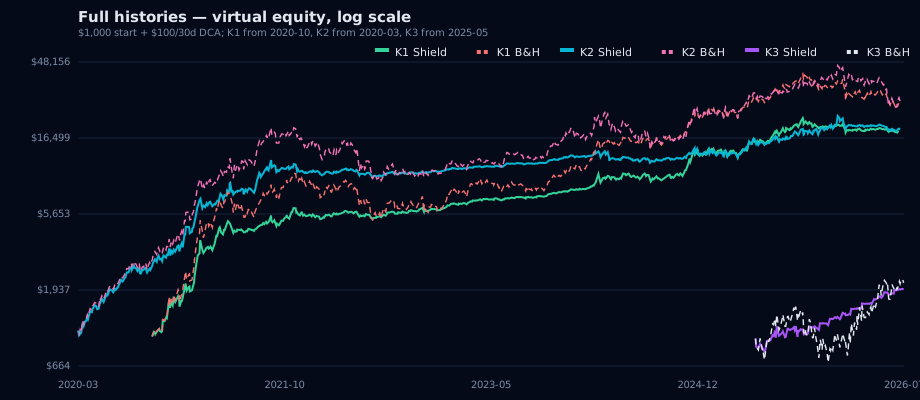
| K1 Majors+Gold | 2020-10 → 2026-07 | 2,096 | $18,149 / $26,938 | +15.6% | 0.39 | 18.4% / 48.7% | 0.85 / 0.49 |
| K2 Veterans+Gold | 2020-03 → 2026-07 | 2,308 | $18,631 / $27,739 | +13.0% | 0.29 | 20.8% / 52.7% | 0.63 / 0.39 |
| K3 New Gen | 2025-05 → 2026-07 | 418 | $1,956 / $2,153 | −13.2% | −0.51 | 18.4% / 54.4% | −0.72 / −0.10 |
Invested per run: $7,900 (K1), $8,600 (K2), $2,300 (K3).
Reading: on their own turf both established baskets show the same signature: the Shield gives up absolute return in a strongly positive window (B&H +241%/+223% total) but nearly triples risk-adjusted efficiency — Calmar 0.85 vs 0.49 (K1) and 0.63 vs 0.39 (K2), with max drawdowns of 18-21% instead of 49-53%. K1 is the stronger of the two on Sharpe, Calmar and drawdown; K2 offers the longest tradable history (from March 2020).
4a. Visualizations
Shared window — Virtual equity (solid) vs Buy & Hold (dashed):
Shared window — Shield drawdown (from the virtual equity peak):
Full histories on one absolute-time axis (log scale):
5. In-sample / out-of-sample splits (shared window)
TWR daily returns (DCA flows removed), rf 5%; IS / OOS-1 / OOS-2 = 50 / 25 / 25 of the trading window. Every re-optimisation after the first uses trailing data only.
| Basket | Segment | Sharpe (S / BH) | CAGR (S / BH) | MaxDD (S / BH) |
|---|---|---|---|---|
| K1 | IS | 0.67 / 0.26 | +22.7% / +13.9% | 14.9% / 25.4% |
| K1 | OOS-1 | −1.26 / −0.93 | −8.1% / −33.6% | 7.4% / 25.4% |
| K1 | OOS-2 | −1.94 / −1.20 | −5.9% / −33.7% | 4.2% / 22.8% |
| K2 | IS | 1.49 / 1.60 | +38.4% / +44.5% | 6.9% / 8.0% |
| K2 | OOS-1 | −0.67 / −0.79 | −13.2% / −29.5% | 16.6% / 22.5% |
| K2 | OOS-2 | −2.21 / −1.57 | −16.8% / −50.6% | 9.1% / 30.0% |
| K3 | IS | −1.76 / −0.95 | −48.3% / −76.6% | 32.0% / 65.8% |
| K3 | OOS-1 | −0.42 / 0.65 | +1.0% / +93.4% | 4.9% / 33.2% |
| K3 | OOS-2 | 0.93 / 2.63 | +12.8% / +188.9% | 3.3% / 23.8% |
The sharpest evidence is the 2026 draw market (OOS-1/OOS-2): on K1 the Shield held max drawdown to 7.4% and 4.2% while Buy & Hold went 25.4% and 22.8% underwater. In every one of the nine segments the Shield's max drawdown is at or below Buy & Hold's.
6. Allocation findings (qualitative)
- PAXG consistently carried the largest single weight in K1 and K2 re-optimisations — the low-vol gold anchor inside the risky sleeve, as expected for a mixed-vol basket.
- SOL was zero-weighted in most K1 re-optimisations (high recent vol vs the other majors); PEAQ was zero-weighted in two of three K3 re-optimisations; QNT was screened out in several K2 windows. The optimizer does the selection without any manual intervention.
- K3's average exposure was only 22.4% — the Shield spent 86% of the window defensive, which is why its result tracks cash more than the basket.
- Exact allocations are withheld (IP). Only the zero/largest-weight facts are disclosed — the same level of detail as the public forward log.
7. Methodology (E2E — identical wiring to the live paper trading service)
1. MACRO loop: KKT risk-parity optimisation on the trailing 180-day window, re-run every 180 days; weights frozen in between (3-13 re-optimisations per run). 2. DAILY loop: Aegis (v14) Deleverage Shield evaluated on each close; threshold rebalancing only trades when the target drifts beyond the 8% deadband; 10 bps fee on every trade, DCA buy and redeploy. 3. DCA parking: while defensive, the $100/30-day contribution parks in USDC and redeploys in one tranche when the Shield re-risks. 4. Data: CoinGecko daily closes, 17-token pool, 2013-2026. 5. Code path: paper_trading.daily_step / macro_reoptimize imported unmodified from the production service — bit-for-bit the math that runs the public forward log.
8. Verdict
- Shared-window winner: K1 Majors+Gold — highest final value, lowest max drawdown (9.8%), positive alpha (+9.27 pp p.a.) in a down market.
- K2 Veterans+Gold is a close second with the longest tradable history (from 2020-03) and the same risk-cutting signature.
- K3 New Gen is not supported by this window: the 2025-26 regime was hostile to newest-generation alts; the Shield limited damage (18.4% vs 54.4% max drawdown) but could not produce a positive return.
- Across every window the Shield's signature is consistent: ~30-36 pp drawdown reduction at the cost of upside in bull regimes; Calmar improves in all three baskets.
- No basket promoted. Recorded as research evidence only.
Simulated results — no real money. Every figure is computed from historical price data by a backtest; no capital was invested and no orders were placed. Figures exclude slippage and liquidity effects, though a simulated 0.1% fee is charged on every trade. Simulated and past performance is not a reliable indicator of future results. AQMath is software, not investment advice.