← All research|Also available in 中文
E2E Walk-Forward Study — Candidate Basket TIA / QNT / XRP + PAXG Anchor
Published: 2026-08-03
Simulated results — no real money. Every figure below is computed from historical price data by a backtest. No capital was invested and no orders were placed. Backtests apply a strategy to the past with full knowledge of how that period turned out, and the figures exclude slippage and liquidity effects, though a simulated 0.1% exchange fee is charged on every rebalance, DCA buy and redeployment. Simulated and past performance is not a reliable indicator of future results. AQMath is software, not investment advice.
Date: 2026-08-03
Engine: Dual-Speed E2E — identical wiring to the live paper trading service (KKT MACRO loop + Aegis (v14) Deleverage Shield)
Status: 📊 RESEARCH — candidate basket evaluated, not promoted
1. Objective
Evaluate a candidate basket built around two newly added tokens (TIA, QNT) under the exact production control stack: the 180-day KKT risk-parity MACRO loop for base weights and the Aegis (v14) Deleverage Shield for daily exposure control. The question is not "can this beat Buy & Hold" but how the shipped machinery behaves on this asset mix — allocation decisions, defensive behaviour and risk-adjusted outcome included.
No parameters were changed. Every run uses production default_config() and the unmodified production code path.
2. Basket and data
| Token | Role | Note |
|---|---|---|
| TIA (Celestia) | candidate — new | launched 2023-10; window bounded by its start |
| QNT (Quant) | candidate — new | long history (2018) |
| XRP | liquid major | long history, deep liquidity |
| PAXG | in-basket anchor | tokenised gold, low-vol sleeve |
| USDC | Shield parking asset | defensive cash, unchanged |
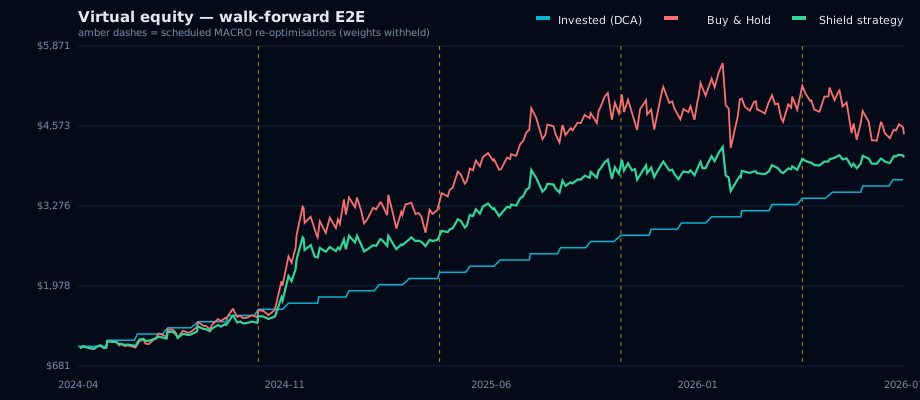
Settings: start $1,000, DCA $100 every 30 days, 10 bps simulated fee on every trade. Common price window 2023-10-31 → 2026-07-27 (1,001 days); 180-day optimizer warm-up, then 821 trading days (2024-04-28 → 2026-07-27) with 5 walk-forward MACRO re-optimisations (2024-04-27, 2024-10-24, 2025-04-22, 2025-10-19, 2026-04-17).
3. Headline result
| Metric | Shield strategy | Buy & Hold (DCA) |
|---|---|---|
| Final value | $4,064 | $4,438 |
| Total invested | $3,700 | $3,700 |
| Total return | +9.9% | +20.0% |
| CAGR | +4.3% | +8.4% |
| XIRR | +4.3% | +8.4% |
| Sharpe (rf 5%) | −0.02 | 0.08 |
| Calmar | 0.25 | 0.34 |
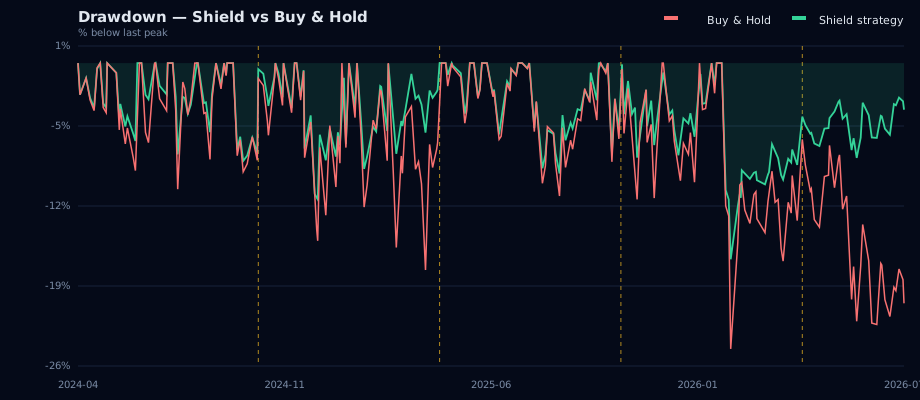
| Max drawdown | 16.9% | 24.6% |
| Alpha (ann., Jensen) | −4.65% | — |
| Beta vs B&H | 0.62 | 1.00 |
| Trading fees | $29.19 | $2.70 |
| Rebalances | 99 | — |
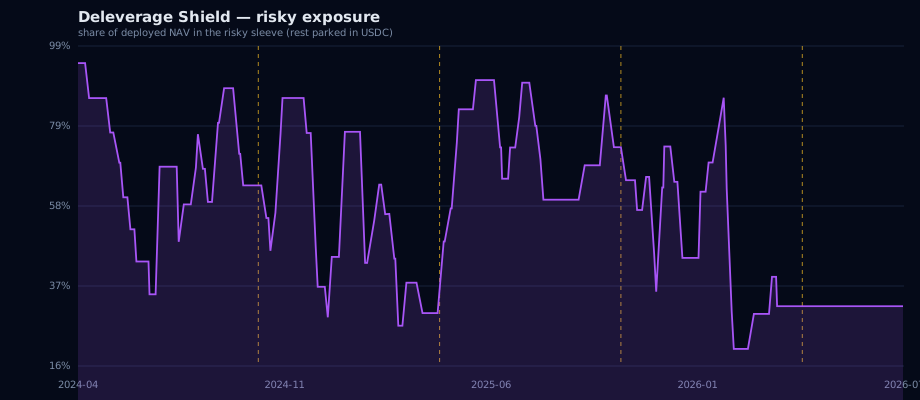
| Defensive days | 235 (29%) | — |
| Avg risky exposure | 56.9% | 100% |
Reading: the Shield did its job on risk — max drawdown came in at 16.9% versus 24.6% for Buy & Hold (−7.7 pp) at a beta of 0.62 — but this window was net-positive for the basket, so the ~43% average de-risking cost absolute return (−4.65% p.a. alpha). Risk cut, upside given up: the classic, expected trade — here with the cost side visible.
3a. Visualizations
Virtual equity — walk-forward E2E (identical DCA schedule both sides):
Drawdown — Shield vs Buy & Hold:
Deleverage Shield risky exposure (share of deployed NAV; remainder parked in USDC):
4. In-sample / out-of-sample splits
TWR daily returns (DCA flows removed), rf 5%. Every re-optimisation after the first uses trailing data only — no lookahead anywhere in the chain.
| Split | Window | Sharpe (S/BH) | Calmar (S/BH) | MaxDD (S/BH) | CAGR (S/BH) |
|---|---|---|---|---|---|
| IS | 2024-04-28 → 2025-06-11 | 1.34 / 1.87 | 2.54 / 3.76 | 18.3% / 23.2% | +46.5% / +87.4% |
| OOS-1 | 2025-06-12 → 2026-01-02 | −0.31 / 0.14 | −0.17 / 0.64 | 14.4% / 15.2% | −2.4% / +9.7% |
| OOS-2 | 2026-01-03 → 2026-07-26 | −1.39 / −1.06 | −1.19 / −1.23 | 17.6% / 29.9% | −20.9% / −36.7% |
Annualised segment CAGRs (TWR, rf 5%); exact daily series in the result JSON.
The sharpest evidence is OOS-2: in the worst segment of the window the Shield held max drawdown to 17.6% while Buy & Hold went 29.9% underwater (−12.3 pp).
5. Allocation findings (qualitative)
- TIA was zero-weighted on every re-optimisation. On the risk-parity objective its recent risk profile never earned a slot next to the other three assets — the optimizer screened it out without any manual intervention.
- PAXG consistently carried the largest single weight (low-vol gold anchor inside the risky sleeve), as expected for a mixed-vol basket.
- Exact allocations are withheld (IP). Only the zero/largest-weight facts are disclosed — the same level of detail as the public forward log.
6. Methodology (E2E — identical wiring to the live paper trading service)
1. MACRO loop: KKT risk-parity optimisation on the trailing 180-day window, re-run every 180 days; weights frozen in between (5 re-optimisations). 2. DAILY loop: Aegis (v14) Deleverage Shield evaluated on each close; threshold rebalancing only trades when the target drifts beyond the deadband; 10 bps fee on every trade, DCA buy and redeploy. 3. DCA parking: while defensive, the $100/30-day contribution parks in USDC and redeploys in one tranche when the Shield re-risks. 4. Data: CoinGecko daily closes, common window 2023-10-31 → 2026-07-27. 5. Code path: paper_trading.daily_step / macro_reoptimize imported unmodified from the production service — bit-for-bit the math that runs the public forward log.
7. Verdict
- The Shield machinery worked as designed on this mix: drawdown 16.9% vs 24.6%, beta 0.62, defensive 29% of days.
- Absolute return trailed Buy & Hold (alpha −4.65% p.a.) in a window where B&H itself finished positive — the cost of ~43% average de-risking.
- The optimizer refused TIA entirely; a TIA-centred thesis is not supported by this machinery on this window.
- Candidate basket NOT promoted. Recorded as research evidence only.
Simulated results — no real money. Every figure is computed from historical price data by a backtest; no capital was invested and no orders were placed. Figures exclude slippage and liquidity effects, though a simulated 0.1% fee is charged on every trade. Simulated and past performance is not a reliable indicator of future results. AQMath is software, not investment advice.