← All research|Also available in 中文
Proteus (v18) on Six Real Shock Windows — Drawdown Delta vs Fixed Weights
Published: 2026-10-12
Simulated results — no real money. Every figure below is computed from historical price data by a backtest. No capital was invested and no orders were placed. Backtests apply a strategy to the past with full knowledge of how that period turned out, and the figures exclude slippage and liquidity effects, though a simulated 0.1% exchange fee is charged on every rebalance, DCA buy and redeployment. Simulated and past performance is not a reliable indicator of future results. AQMath is software, not investment advice.
Date: 2026-10-12
Engine: Proteus (v18) adaptive Deleverage Shield — the live production engine — measured on the exact production data path
Status: ✅ The Shield cut max drawdown in 6 of 6 real shock windows versus a fixed-weight baseline (average −13.3 pp); an exposure-matched control shows this was mostly de-risking, while a causal matched control and a volatility-targeting rule at matched exposure still show a clear timing edge. Windows were selected because they were crashes — this is a stress test, not a forecast.
1. Objective
A narrow, honest question: on real historical shock windows — not synthetic ones — does the v18 regime-split Shield cut drawdown versus a naive fixed-weight rebalance? The result is reported per window (an average can hide a single episode carrying the whole improvement), side-by-side with the baseline, and with the cost side shown too: turnover and any return bled during calm periods when the Shield de-risks unnecessarily. A shield that cuts drawdown in a crash but bleeds through false alarms is not clearly better than fixed weights, so both sides are measured.
The six windows were selected because they were crashes — the study is a stress test of the design under known shocks, not a forecast or a hit rate.
2. Method — the exact production path
Every run uses the live production wiring, not a research approximation.
| Element | Setting |
|---|---|
| Data path | The live per-user daily signal path: the full available daily-close history is cold-replayed each day through the production v18 shield dispatcher, with persisted shield state |
| Weights | The production KKT risk-parity macro loop, re-optimised every 180 days on trailing data only |
| Baseline (pre-registered) | Naive fixed-weight rebalance: 60% risky / 40% USDC, same KKT weights, same 180-day cadence, no Shield |
| Signal timing | Daily close. Exposure decided at a close is applied to the next interval's basket return |
| Costs | 0.1% fee per traded notional; $10,000 start, no DCA |
| Pre-registered metric | MaxDD_delta = MaxDD(baseline) − MaxDD(shield), per window and averaged |
The Shield scales every threshold off the basket's own trailing downside volatility, so its sensitivity is basket-relative rather than a single fixed number, and an asymmetric ramp moves held exposure toward that target. No parameter was changed, re-fit or re-tuned — the production configuration is used throughout. (The exact signal constants live in the private engine repo.)
Leave-one-crash-out is satisfied by construction. The KKT weights are causal (each re-optimisation sees only the trailing 180 days) and v18 carries no cross-window fit, so no window's result is influenced by any other crash. Each window is therefore measured strictly out-of-sample.
3. Windows and baskets (real data; 2008 not runnable)
Seven windows were requested; six are runnable. The 2008 GFC is impossible for any crypto basket — the oldest token in the dataset (BTC) starts 2013-04-28, so no crypto price exists for 2008. Early windows use the five longest-history legacy tokens; Mar-2020 uses the production basket minus SOL (SOL starts 2020-04-10, after that crash).
| Window | Cause | Basket | Dates |
|---|---|---|---|
| Aug 2015 | CNY devaluation | BTC · XRP · DOGE · XMR · XLM | 2015-08-01 → 2015-09-30 |
| Late 2018 | Crypto winter | BTC · XRP · DOGE · XMR · XLM | 2018-11-01 → 2018-12-31 |
| Mar 2020 | Pandemic | ADA · BNB · ETH · XRP | 2020-02-14 → 2020-04-30 |
| 2022 May–Jun | Luna / 3AC contagion | ADA · BNB · ETH · XRP · SOL | 2022-05-01 → 2022-06-30 |
| Mar 2023 | Bank failure (SVB / Signature) | ADA · BNB · ETH · XRP · SOL | 2023-03-01 → 2023-03-31 |
| Aug 2024 | Yen carry unwind | ADA · BNB · ETH · XRP · SOL | 2024-07-15 → 2024-09-30 |
4. Result — drawdown delta per window (Test A)
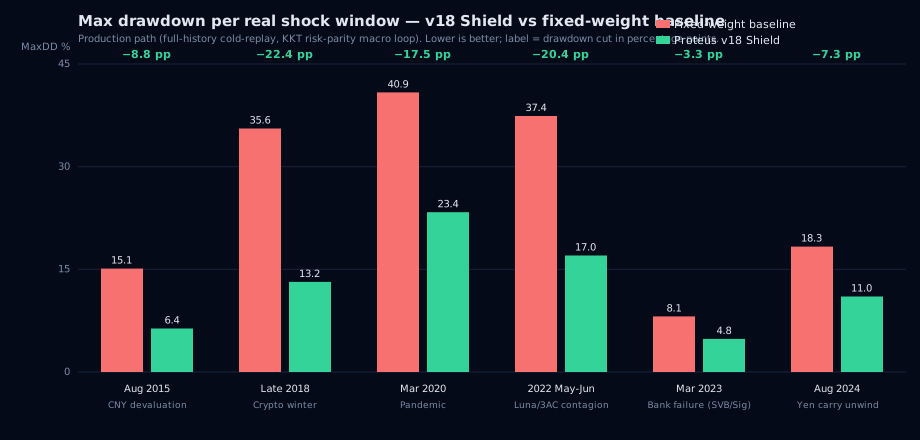
| Window | Cause | MaxDD Shield | MaxDD Base | Δ (protection) | B&H MaxDD |
|---|---|---|---|---|---|
| Aug 2015 | CNY devaluation | 6.35% | 15.11% | +8.75 pp | 24.33% |
| Late 2018 | Crypto winter | 13.16% | 35.58% | +22.42 pp | 52.83% |
| Mar 2020 | Pandemic | 23.35% | 40.86% | +17.50 pp | 60.55% |
| 2022 May–Jun | Luna / 3AC | 17.02% | 37.40% | +20.38 pp | 55.48% |
| Mar 2023 | SVB / Signature | 4.83% | 8.12% | +3.29 pp | 13.24% |
| Aug 2024 | Yen carry | 11.03% | 18.32% | +7.29 pp | 29.40% |
| Average | — | 12.63% | 25.90% | +13.27 pp | — |
The Shield cut drawdown in 6 of 6 windows, by +3.3 to +22.4 pp (average +13.3 pp). Dominance check: no single episode contributes more than 50% of the total improvement — the largest (Late 2018, +22.42 pp) is ~28% of the sum of positive deltas, so the average is not carried by one outlier.
5. Cost side — calm-period whipsaw (Test C)
For each shock, the 90 calm days immediately preceding it are measured: does the Shield churn and give up return when there is nothing to protect against?
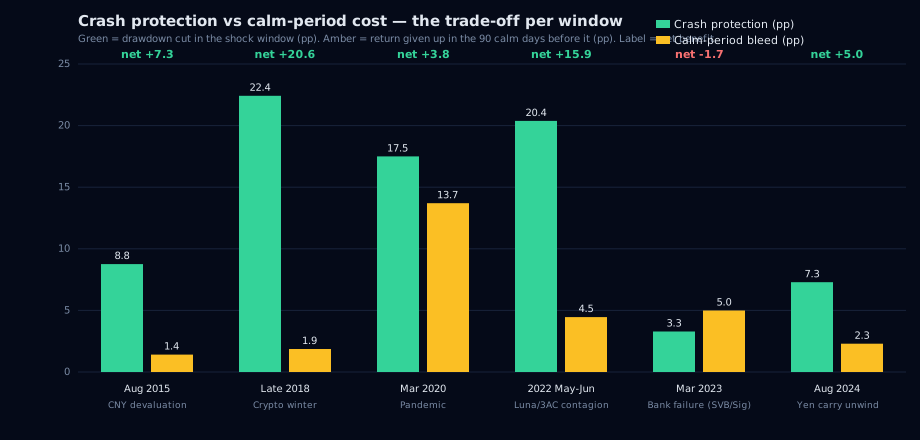
| Window | Calm return Shield | Calm return Base | Calm bleed | Shield rebalances (calm) | Net benefit |
|---|---|---|---|---|---|
| Aug 2015 | +14.50% | +15.91% | +1.41 pp | 17 | +7.35 pp |
| Late 2018 | −2.50% | −0.64% | +1.87 pp | 9 | +20.55 pp |
| Mar 2020 | +5.64% | +19.35% | +13.70 pp | 9 | +3.80 pp |
| 2022 May–Jun | −2.03% | +2.42% | +4.46 pp | 9 | +15.92 pp |
| Mar 2023 | +6.84% | +11.84% | +4.99 pp | 3 | −1.70 pp |
| Aug 2024 | +3.87% | +6.17% | +2.30 pp | 0 | +4.99 pp |
Net benefit = MaxDD_delta − calm_bleed. It is positive in 5 of 6 windows. The cost shows up exactly where predicted:
- Mar 2020 — the calm window before the crash was a strong rally; the Shield's lower exposure lagged it (+13.70 pp bleed), which ate most of the crash protection on a net basis (+3.80 pp).
- Mar 2023 — a shallow, short event: the small protection (+3.29 pp) was slightly outweighed by the calm bleed, for a net −1.70 pp. This is the one window where the fixed-weight baseline came out marginally ahead net.
6. Robustness — the V/D neighbourhood (Test B)
To confirm the result is not a knife-edge fit to two window lengths, the Shield's volatility-window and downside-window lengths were swept across a wide neighbourhood (12 alternative settings plus the production point). Every cell held +12.4 to +13.8 pp mean protection with 6/6 window wins, and the production operating point sits mid-range (+13.27 pp). Protection is a property of the design, not of a precisely tuned window.
7. Exposure-matched control — isolating timing from de-risking (Test D)
A reader's fair challenge: the Shield's average in-window exposure (~0.21–0.35) is much lower than the 60% baseline's, so part of the drawdown cut is less beta, not better timing. To answer, two signal-free control legs are built on the same KKT return stream as the Shield, with the same average exposure per window:
- CONST(c) — a constant exposure
c = mean(shield exposure)over the window, zero turnover fees (a deliberate handicap in the control's favour, since the Shield does pay fees when it rebalances). - VOL-target —
min(1, tv / trailing_vol)withtvbisected so the window's mean exposure equalsc, wheretrailing_volis the 30-day annualised realised stdev of the KKT basket, computed only from returns strictly before each date (causal, no drawdown signal). This leg pays fees at the same rate as the Shield.
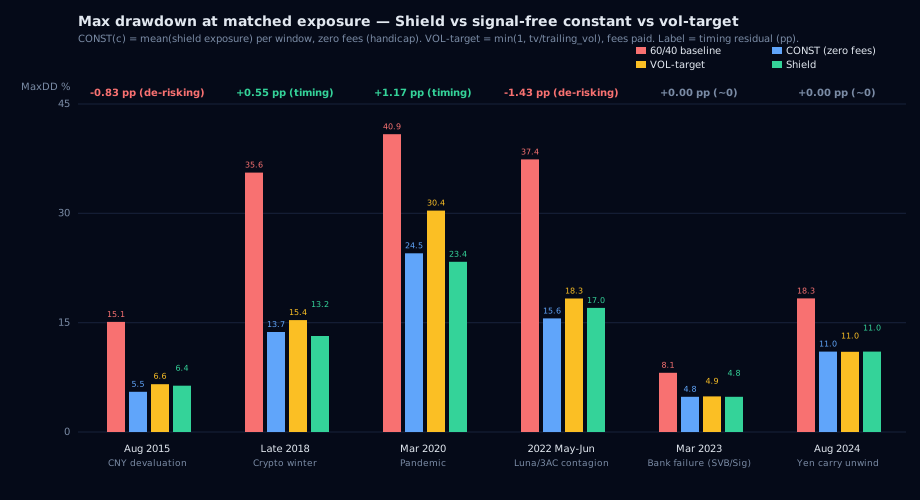
| Window | Shield | Base 60/40 | CONST(c) | VOL-target | Residual (CONST − Shield) | Residual (VOL − Shield) |
|---|---|---|---|---|---|---|
| Aug 2015 | 6.35% | 15.11% | 5.52% | 6.56% | −0.83 pp | +0.21 pp |
| Late 2018 | 13.16% | 35.58% | 13.72% | 15.35% | +0.55 pp | +2.19 pp |
| Mar 2020 | 23.35% | 40.86% | 24.52% | 30.37% | +1.17 pp | +7.02 pp |
| 2022 May–Jun | 17.02% | 37.40% | 15.59% | 18.32% | −1.43 pp | +1.30 pp |
| Mar 2023 | 4.83% | 8.12% | 4.83% | 4.88% | +0.00 pp | +0.05 pp |
| Aug 2024 | 11.03% | 18.32% | 11.03% | 11.01% | +0.00 pp | −0.03 pp |
Against the zero-fee CONST, the Shield is shallower in 2 of 6 windows, deeper in 2, and identical in 2 (the flat-exposure windows where the Shield never changed exposure, so it matches the constant by construction); the mean residual is −0.09 pp — essentially zero. A causal variant, where c is calibrated on the 420-day warm-up preceding the shock (no look-ahead into the window), reverses that: the Shield is shallower in 5 of 6 with a mean residual of +5.37 pp. The honest reading: against a constant that already knows the shock's average exposure, the Shield's drawdown cut was mostly de-risking; against a constant that can only see what a live system would have seen, the Shield's adaptivity buys a meaningful edge.
Against the fee-paying VOL-target, the Shield is shallower in 5 of 6 windows, mean residual +1.79 pp, worst −0.03 pp. The Shield's timing is better than a naive volatility-targeting rule at matched exposure.
A paired block bootstrap over the concatenated shock-window days (368 days, 1000 reps, 20-day blocks) gives:
- Shield vs CONST: log-growth gap −5.83% [−17.21, +4.93] (5/50/95); MaxDD gap −2.67 pp [−8.68, +2.59].
- Shield vs VOL: log-growth gap +9.11% [−4.46, +24.11]; MaxDD gap +4.99 pp [−2.34, +11.49].
The MaxDD gap is a path-permutation robustness check, not a sampling confidence interval — the effective sample for a max-statistic is the window count, not the daily observations.
8. Interpretation
- The drawdown mandate holds on real shocks — per-window, out-of-sample, on the exact production path, against a pre-registered baseline.
- The cost is real but small. Net of the calm-period bleed the Shield is still ahead in 5 of 6 windows; the exception is a shallow bank-failure scare.
- Timing vs de-risking. Against a zero-fee signal-free constant sized to the Shield's own in-window mean exposure, the drawdown cut was mostly de-risking (mean residual −0.09 pp; 2/6 shallower, 2 flat-exposure ties, 2 deeper). Against a causal constant that cannot see the shock ahead, or against a fee-paying volatility-targeting rule at the same average exposure, the Shield's timing buys a clear edge (+5.37 pp and +1.79 pp mean residual, 5/6 in each case).
9. Caveats
- 2008 is not runnable for a crypto basket (BTC data starts 2013-04-28).
- Mar-2020 uses the production basket minus SOL; the two early windows use a five-token legacy basket (the tokens that existed then).
- Fees are modeled at the production rate; slippage, spreads and liquidity are not.
- Exact KKT allocations are withheld (IP).
- The six windows are a stress test, not a forecast. They were selected because they were crashes; the 6/6 result is not a predictive hit rate.
- Exposure matching uses each window's own mean exposure (an in-window calibration); the causal variant, calibrated on the pre-window portion, is reported alongside so the look-ahead is bounded and disclosed.
- The VOL-target's 30-day trailing-vol window is a control parameter chosen for exposure parity, not a tuning of the Shield itself.
- Simulated and past performance is not a reliable indicator of future results. AQMath is software, not investment advice.
10. Reproducibility
Research harness (git-ignored, lives in the private engine repo, not deployed). It imports the production shield, macro-weighting and simulation functions unchanged, cold-replays the full-history window each day with persisted state, and cross-checks that the production setting reproduces the per-window deltas exactly. The exposure-matched control legs (CONST, VOL-target) are produced by the same harness on the same production path. Historical CSVs are sourced locally and are not committed. Exact KKT allocations are withheld (IP).
Bottom line: on six real shock windows across 2015–2024, run through the exact production path, the live Proteus (v18) Shield cut maximum drawdown in every one versus a fixed-weight baseline — average +13.3 pp, no single episode driving it — at a small, quantified calm-period cost that leaves net benefit positive in five of six. Against a signal-free constant sized to its own average exposure, the drawdown cut was mostly de-risking; against a causal constant or a fee-paying volatility-targeting rule at matched exposure, the Shield's timing is clearly better. The protection is robust across a wide parameter neighbourhood.