← All research|Also available in 中文
Regime Autopsy — does the Shield survive its worst regimes?
Published: 2026-08-07
Simulated results — no real money. Every figure below is computed from historical price data by a backtest. No capital was invested and no orders were placed. Backtests apply a strategy to the past with full knowledge of how that period turned out, and the figures exclude slippage and liquidity effects, though a simulated 0.1% exchange fee is charged on every rebalance, DCA buy and redeployment. Simulated and past performance is not a reliable indicator of future results. AQMath is software, not investment advice.
Date: 2026-08-07
Engine: Aegis (v14) Dual-Speed E2E — identical wiring to the live paper trading service (180-day KKT risk-parity MACRO loop with the ADV-K2 liveness screen + Aegis (v14) Deleverage Shield)
Status: 📊 RESEARCH — worst-regime out-of-sample stress study, no basket promoted
1. Objective
Every published study so far scored the Shield on whole windows. The question left open is the one critics ask first: what happens inside the worst segment — a crash regime the optimizer never saw during fitting?
This study slices the frozen-weight walk-forward series post-hoc along six named crash regimes and measures the Shield's max drawdown against Buy & Hold inside each one. Every regime is scored by weights and parameters that were frozen before it happened — by construction out of sample.
No parameters were changed. Every run uses production default_config() and the unmodified production code path — walk-forward, no lookahead. This is also the first study to run with the ADV-K2 liveness screen active at every re-optimisation, exactly as in the production service.
2. Baskets and data
Three structurally different long-history baskets, each anchored with PAXG:
| Basket | Tokens | Thesis |
|---|---|---|
| A Majors + Gold | BTC, ETH, XRP, XMR + PAXG | blue-chip core with a gold anchor |
| B 2019-20 Gen | ETH, LINK, ATOM, DOT + PAXG | the last-cycle generation |
| C Landmine | BTC, ETH, CEL + PAXG | deliberately includes a token that went to zero (Celsius) |
Six regime windows were cut on every basket: R1 Mar-2020 crash, R2 May-2021 unwind, R3 LUNA contagion, R4 FTX collapse, R5 Aug-2024 carry unwind, R6 2025-26 corrections.
Settings: start $1,000, DCA $100 every 30 days, 10 bps simulated fee on every trade, 180-day optimizer warm-up, MACRO re-optimisation every 180 days (12-13 re-optimisations per basket).
Data: Yahoo Finance daily closes (unadjusted), fetched 2026-08-07; common-date alignment per basket. This study uses a different data source than the earlier CoinGecko-based studies; daily-close figures are comparable but not bit-identical.
3. Headline result — per-regime drawdown cuts
Max drawdown inside each regime window, Shield vs Buy & Hold. TWR daily returns, DCA flows removed, rf 5%.
| Basket | Regime | Window | MDD Shield | MDD B&H | Cut |
|---|---|---|---|---|---|
| A Majors+Gold | R2 May-2021 unwind | 2021-04 → 2021-07 | 15.9% | 23.9% | +8.0 pp |
| A Majors+Gold | R3 LUNA contagion | 2022-04 → 2022-06 | 16.8% | 44.1% | +27.3 pp |
| A Majors+Gold | R4 FTX collapse | 2022-10 → 2023-01 | 3.3% | 13.3% | +9.9 pp |
| A Majors+Gold | R5 Aug-2024 carry unwind | 2024-07 → 2024-09 | 12.4% | 17.5% | +5.0 pp |
| A Majors+Gold | R6 2025-26 corrections | 2025-01 → 2026-08 | 18.9% | 32.1% | +13.2 pp |
| B 2019-20 Gen | R2 May-2021 unwind | 2021-04 → 2021-07 | 19.1% | 40.8% | +21.7 pp |
| B 2019-20 Gen | R3 LUNA contagion | 2022-04 → 2022-06 | 21.3% | 44.8% | +23.5 pp |
| B 2019-20 Gen | R4 FTX collapse | 2022-10 → 2023-01 | 1.9% | 9.2% | +7.3 pp |
| B 2019-20 Gen | R5 Aug-2024 carry unwind | 2024-07 → 2024-09 | 9.5% | 15.0% | +5.5 pp |
| B 2019-20 Gen | R6 2025-26 corrections | 2025-01 → 2026-08 | 22.5% | 34.9% | +12.4 pp |
| C Landmine | R2 May-2021 unwind | 2021-04 → 2021-07 | 12.1% | 15.8% | +3.7 pp |
| C Landmine | R3 LUNA contagion | 2022-04 → 2022-06 | 4.1% | 11.4% | +7.3 pp |
| C Landmine | R4 FTX collapse | 2022-10 → 2023-01 | 5.4% | 17.8% | +12.4 pp |
| C Landmine | R5 Aug-2024 carry unwind | 2024-07 → 2024-09 | 9.8% | 11.8% | +1.9 pp |
| C Landmine | R6 2025-26 corrections | 2025-01 → 2026-08 | 20.1% | 32.9% | +12.8 pp |
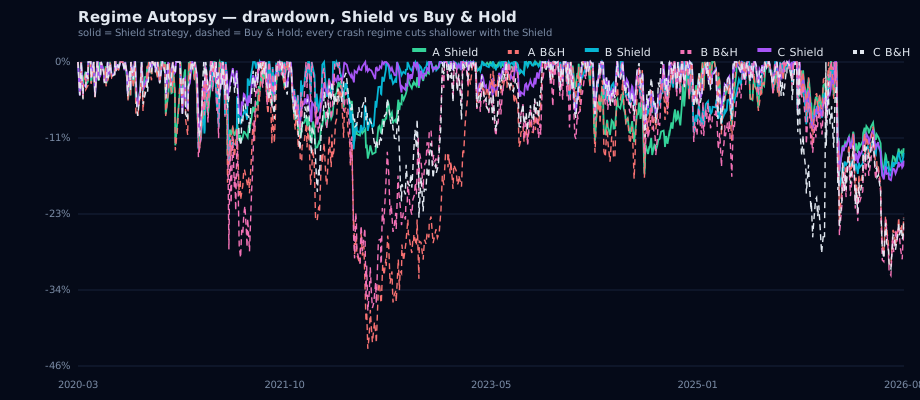
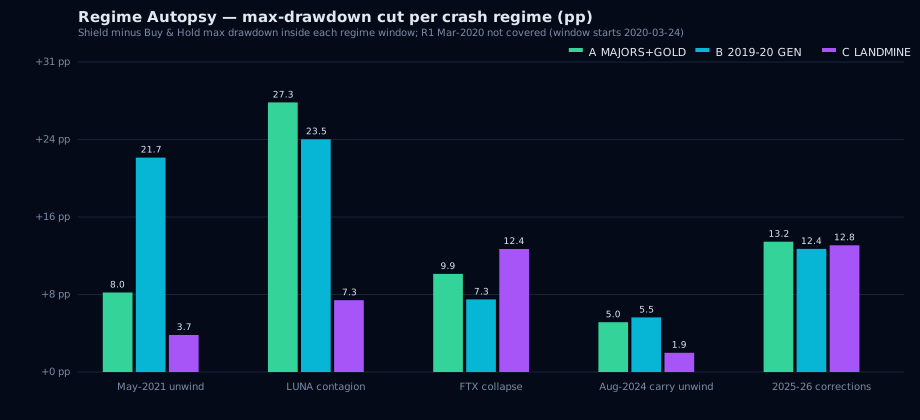
15 of 15 covered regime-basket combinations show a positive drawdown cut. The worst segments: LUNA contagion held to 16.8% vs 44.1% on basket A and 21.3% vs 44.8% on basket B; FTX collapse cut to 3.3% vs 13.3% (A) and 1.9% vs 9.2% (B).
R1 (Mar-2020 crash) is NOT covered — the PAXG anchor plus the 180-day warm-up starts baskets A and C on 2020-03-24, after the flush bottom. Reported as a gap, not hidden.
Note on basket C: its Buy & Hold column includes the dead CEL token for the whole window — that is the point of the basket. The Shield side runs with the liveness screen, which zeroed CEL's weight once (2025-08-24, see the liveness screen study).
4. Full-window runs
Each basket on its full walk-forward window (warm-up included).
| Basket | Window | Days | Final (Shield / B&H) | CAGR (S / BH) | Sharpe (S / BH) | MaxDD (S / BH) | Calmar (S / BH) |
|---|---|---|---|---|---|---|---|
| A Majors+Gold | 2020-03 → 2026-08 | 2,327 | $15,650 / $23,064 | +9.7% / +16.5% | 0.20 / 0.32 | 16.9% / 43.2% | 0.57 / 0.38 |
| B 2019-20 Gen | 2021-02 → 2026-08 | 1,998 | $8,555 / $11,043 | +2.2% / +7.1% | −0.12 / 0.05 | 18.9% / 37.5% | 0.12 / 0.19 |
| C Landmine | 2020-03 → 2026-08 | 2,327 | $17,541 / $21,732 | +11.6% / +15.5% | 0.32 / 0.32 | 17.8% / 31.2% | 0.65 / 0.50 |
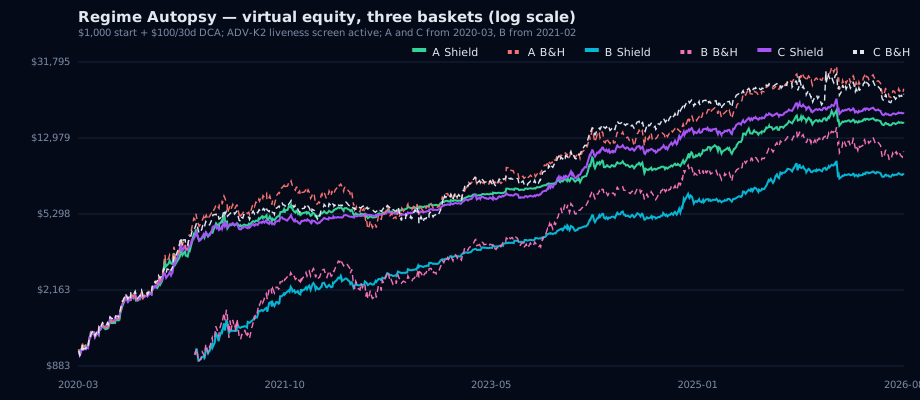
Reading: the signature is the same as in every earlier study — the Shield gives up absolute return in windows that contain strong bull legs and buys it back in drawdown. On baskets A and C the full-window risk-adjusted efficiency improves (Calmar 0.57 vs 0.38 and 0.65 vs 0.50). Basket B is the honest exception: it was the weakest basket of the three, and on B the full-window Sharpe and Calmar favour Buy & Hold — the Shield's case on B rests entirely on the per-regime drawdown cuts above, not on full-window efficiency.
5. Visualizations
Virtual equity, all three baskets on one absolute-time axis (log scale):
Drawdown — Shield vs Buy & Hold, full histories:
Per-regime max-drawdown cut (percentage points), grouped by basket:
6. Gap vs drift — what a daily-close system can catch
The Shield reacts to daily closes. A same-day open gap is uncatchable by any close-based system. Decomposition of each regime's drawdown on the equal-weight risky basket (no PAXG) into the close-to-open leg (gap) and the open-to-close leg (drift):
| Regime | Close-to-close DD | Gap leg | Drift leg | Gap share | Worst single day |
|---|---|---|---|---|---|
| R2 May-2021 unwind | 59.3% | 3.3% | 59.6% | 5% | −30.0% |
| R3 LUNA contagion | 68.4% | 0.4% | 68.6% | 1% | −18.5% |
| R4 FTX collapse | 33.6% | 0.2% | 33.6% | 1% | −18.4% |
| R5 Aug-2024 carry unwind | 33.1% | 0.1% | 33.1% | 0% | −8.5% |
| R6 2025-26 corrections | 61.9% | 0.5% | 61.8% | 1% | −18.7% |
Crypto crashes are drift-dominated: 95-100% of each regime's damage unfolds in the seen, intraday leg that a daily-close system can react to. The uncatchable residual is concentrated in single worst days (May 19 2021: −30% on the equal-weight risky basket).
7. Caveats (disclosed, not hidden)
- R1 Mar-2020 is uncovered by design (PAXG anchor + 180-day warm-up start the baskets on 2020-03-24). The study cannot speak to that crash.
- R6 is defensive-heavy. In the 2025-26 window the Shield spent roughly 40% of days parked in USDC (236 of 583 regime days on basket B). That is the same defensive bias visible in the live forward log — it protects, but it also costs participation.
- This article replaces a withheld earlier draft. The first version of this study ran without the liveness screen, and the volatility cap gave the dead CEL token a 24.7% frozen weight in one basket-C re-optimisation, contaminating the results. That flaw is fixed in production and in this study — see the liveness screen article. The screen fired exactly once across all 38 re-optimisations (CEL, 2025-08-24); baskets A and B are bit-identical to their unscreened runs.
- Data source change: Yahoo Finance (unadjusted closes) instead of CoinGecko; figures are comparable to, not identical with, earlier studies.
8. Methodology
1. MACRO loop: KKT risk-parity optimisation on the trailing 180-day window, re-run every 180 days; weights frozen in between (12-13 re-optimisations per basket). After each re-optimisation the ADV-K2 liveness screen zeroes the weight of any token that failed the $1M/day trailing-volume test at two consecutive re-opts (fail-open, trailing data only) — the same screen running in the production service. 2. DAILY loop: Aegis (v14) Deleverage Shield evaluated on each close; threshold rebalancing only trades when the target drifts beyond the deadband; 10 bps fee on every trade, DCA buy and redeploy. 3. Regime cuts: post-hoc slices of the frozen-weight walk-forward series along named crash windows — each regime is scored by parameters frozen before it. Minimum 20 days inside a slice to be scored. 4. Metrics: TWR daily returns (DCA flows removed), rf 5%; max drawdown from the virtual equity peak. Buy & Hold always tracks the full raw basket composition, including tokens the screen zeroes. 5. Data: Yahoo Finance daily closes (unadjusted), fetched 2026-08-07; OHLC for the gap/drift decomposition from the same source. 6. Code path: paper_trading.daily_step / macro_reoptimize imported unmodified from the production service — bit-for-bit the math that runs the public forward log.
9. Verdict
- 15/15 covered regime-basket combinations show a positive out-of-sample drawdown cut. The modulator holds on regimes it never saw.
- Headline worst segments: LUNA contagion 16.8% vs 44.1% (A) and 21.3% vs 44.8% (B); FTX collapse 3.3% vs 13.3% (A).
- The return cost is real and visible in every CAGR column: the Shield trails Buy & Hold on absolute return in all three full windows.
- Basket B shows the honest limit of the claim: per-regime cuts yes, but full-window risk-adjusted metrics favour Buy & Hold on that basket.
- With the liveness screen active the landmine basket is clean — the dead token never carries real weight after 2025-08, and the full-window Calmar there is the best of the three (0.65).
- No basket promoted. Recorded as research evidence only.
Simulated results — no real money. Every figure is computed from historical price data by a backtest; no capital was invested and no orders were placed. Figures exclude slippage and liquidity effects, though a simulated 0.1% fee is charged on every trade. Simulated and past performance is not a reliable indicator of future results. AQMath is software, not investment advice.