← All research|Also available in 中文
Three Price Feeds, One Strategy — does the signal depend on who tells you the price?
Published: 2026-08-09
Simulated results — no real money. Every figure below is computed from historical price data by a backtest. No capital was invested and no orders were placed. Backtests apply a strategy to the past with full knowledge of how that period turned out, and the figures exclude slippage and liquidity effects, though a simulated 0.1% exchange fee is charged on every rebalance, DCA buy and redeployment. Simulated and past performance is not a reliable indicator of future results. AQMath is software, not investment advice.
Date: 2026-08-09
Engine: Aegis (v14) Deleverage Shield — production evaluate_shield / backtest_modulator imported unmodified; daily-close series pulled independently from three public price feeds
Status: 📊 RESEARCH — data-source sensitivity study, no parameter changed, no basket promoted
1. Objective
Every study published so far (OOS, Monte Carlo, Regime Autopsy, Robustness) treated the price series as ground truth. It is not — and the live pipeline is built as if it knows. Three independent collectors (aggregator, Coinbase, Kraken) push raw daily prices into the data pipeline, which for every token and date de-duplicates, removes per-source outliers (4.5 standard deviations on a 7-day rolling window), takes the cross-source median of that date's prices, and fills gaps of ≤2 days by interpolation before the strategy ever sees the number. The shield does not read one feed blindly — but only for the tokens that more than one collector actually collects. Section 2 shows where that condition fails.
The question this study asks: if the shield had trusted a different feed, would the user have gotten different signals?
Three feeds were pulled independently for the eight tokens in the frozen Aegis (v14) plan: the aggregator the production collector uses (CoinGecko), and two exchange-native feeds (Coinbase Exchange candles, Kraken OHLC).
2. Coverage — already a finding
Listing status on 2026-08-09 — and what the production collectors actually pull (per their configs):
| Token | Listed: Aggregator | Coinbase | Kraken | Production |
|---|---|---|---|---|
| ATH | ✓ | ✓ | ✓ | 1 source |
| DAG | ✓ | ✗ | ✓ | 1 source |
| EWT | ✓ | ✗ | ✓ | 1 source |
| PAXG | ✓ | ✓ | ✓ | 3 sources |
| PEAQ | ✓ | ✗ | ✓ | 1 source |
| PYTH | ✓ | ✓ | ✓ | 3 sources |
| TIA | ✓ | ✓ | ✓ | 3 sources |
| TICS | ✓ | ✗ | ✗ | 1 source |
Two findings. First, TICS is single-source everywhere: no exchange lists it, so any bad print there is undetectable by construction. Second, and more surprising: in production, 5 of the 8 plan tokens are single-source. The exchange collectors only pull TIA, PYTH and PAXG. Kraken lists ATH, DAG, EWT and PEAQ as well (this study uses its feed for them), but the production Kraken collector is not configured to collect them — so for those four tokens the cross-source median described above operates on exactly one input, equivalent to trusting the aggregator alone.
One more coverage fact with operational weight: the aggregator's free tier (what the production collector uses — browser User-Agent, no key) is now capped at 365 days of history; deeper requests answer HTTP 401. That caps this study's window and would cap any fresh deployment's backfill.
3. How much do the feeds disagree?
Pairwise absolute relative difference of same-day prices, over overlapping dates. (One convention fix first: the aggregator's "daily" point is the UTC-00:00 snapshot, i.e. the previous day's close — verified by the 2025-10-10 crash printing under 10-10 on both exchanges and under 10-11 there. All series were relabelled to the exchange convention before comparison.)
| Pair | Token | n | Median | p95 | Max |
|---|---|---|---|---|---|
| Coinbase vs Kraken | PAXG | 458 | 0.04% | 0.22% | 0.80% |
| Coinbase vs Kraken | PYTH | 535 | 0.14% | 0.48% | 1.18% |
| Coinbase vs Kraken | TIA | 720 | 0.09% | 0.38% | 3.34% |
| Coinbase vs Kraken | ATH | 514 | 0.21% | 0.85% | 3.52% |
| Aggregator vs exchange | PAXG | 364 | 0.04% | 0.26% | 1.64% |
| Aggregator vs exchange | PYTH | 364 | 0.15% | 17.5% | 28.2% |
| Aggregator vs exchange | ATH | 364 | 0.17% | 13.8% | 28.9% |
| Aggregator vs exchange | TIA | 364 | 0.09% | 59.3% | 76.1% |
| Aggregator vs Kraken | PEAQ | 364 | 0.27% | 23.6% | 44.9% |
| Aggregator vs Kraken | EWT | 364 | 1.87% | 33.0% | 56.3% |
| Aggregator vs Kraken | DAG | 270 | 3.53% | 40.2% | 50.4% |
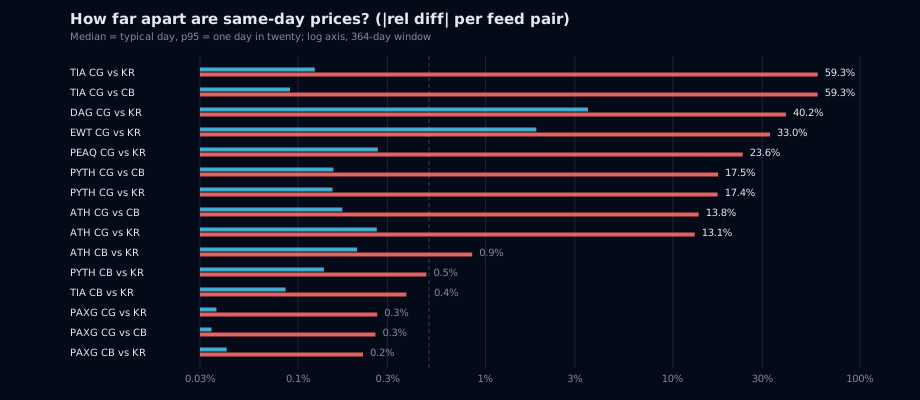
Median (blue) and p95 (red) same-day feed divergence, per token and feed pair; log axis. Dashed guide: 0.5%, the Aegis (v14) rebalance threshold.
The exchanges agree with each other. Venue-to-venue divergence on the same day is noise: median 0.04–0.21%, p95 under 0.9%. Price discovery is not the issue.
The aggregator mostly agrees — until it doesn't. Median divergence is equally small, but the tail is enormous: p95 between 13% and 59%, worst single-day gaps up to 76%. The disagreement is not a wide distribution; it is a handful of extreme prints. Section 4 shows where they come from.
4. Anatomy of the bad prints
Suspect single-day moves (|return| > 30%) over the 364-day window, counted per feed and token. For the aggregator, a jump is uncorroborated when no exchange shows a >15% move on the same or a neighbouring day — i.e. it is a bad print, not a market event.
| Feed | Token | Jumps | Uncorroborated |
|---|---|---|---|
| Aggregator | TIA | 17 | 15 |
| Aggregator | TICS | 12 | 12 |
| Aggregator | DAG | 9 | 7 |
| Aggregator | EWT | 6 | 6 |
| Aggregator | PEAQ | 3 | 1 |
| Aggregator | ATH | 1 | 0 |
| Aggregator | PYTH | 1 | 0 |
| Kraken | (6 tokens) | 11 | — |
| Coinbase | (3 tokens) | 5 | — |
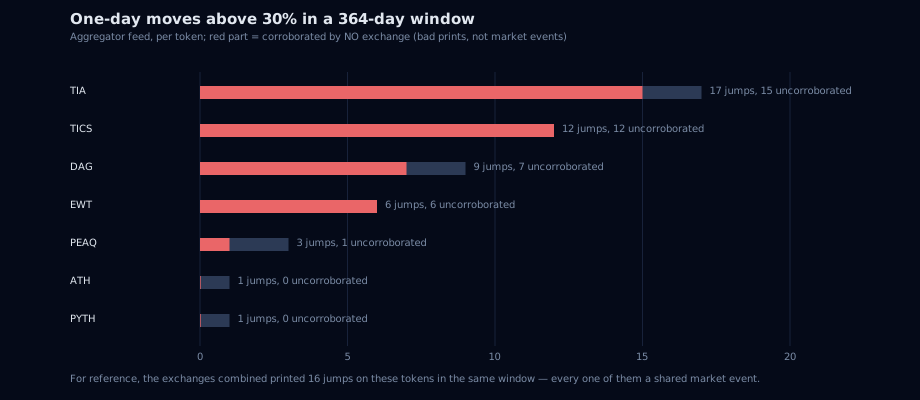
Single-day moves above 30% on the aggregator feed, per token (grey); the red part is corroborated by no exchange — bad prints, not market events.
The production feed printed 49 one-day moves above 30% in a single year, 41 of them corroborated by no exchange — prints like +107% and −52% on TIA in consecutive weeks while both exchanges traded flat. The exchanges' jumps, by contrast, are nearly all shared events (the October 2025 liquidation cascade appears on every feed that lists the token). The contamination concentrates in exactly the thin-liquidity tokens a small-cap plan must hold.
For context on why this reaches the strategy: the pipeline's outlier filter drops prices deviating more than 4.5 standard deviations from a 7-day rolling mean, per source — a useful sieve for blue chips, but a thin token's own volatility inflates the local std, so extreme prints can survive it. Where the merge has three sources (TIA, PYTH, PAXG) the cross-source median then absorbs any survivor; where a token is single-source (§2), nothing stands between the print and the shield. The validator additionally flags moves above 50% but does not reject them, and moves of 30–50% are not checked at all.
5. Replay — same shield, three feeds
The real Aegis (v14) shield (evaluate_shield, production constants, 10 bps fees, threshold rebalancing) was replayed once per feed plus a consensus arm — the per-token median across the three feeds, i.e. the same merge rule the production pipeline applies to TIA/PYTH/PAXG — on the 4-token sub-basket listed everywhere (weights: the frozen plan renormalised — ATH 20.1%, PAXG 52.6%, PYTH 14.4%, TIA 12.9%). Window: 364 days, 2025-08-09 → 2026-08-07. $10,000 start + $300/30d DCA.
| Feed | Final | MaxDD | Sharpe | Calmar | Fees | Rebalances |
|---|---|---|---|---|---|---|
| Aggregator (production) | $16,481 | 14.4% | 1.31 | 1.48 | $37 | 25 |
| Coinbase | $16,580 | 14.1% | 1.35 | 1.57 | $33 | 22 |
| Kraken | $16,601 | 14.4% | 1.34 | 1.55 | $35 | 23 |
| Consensus (median of 3) | $16,600 | 14.3% | 1.34 | 1.55 | $35 | 23 |
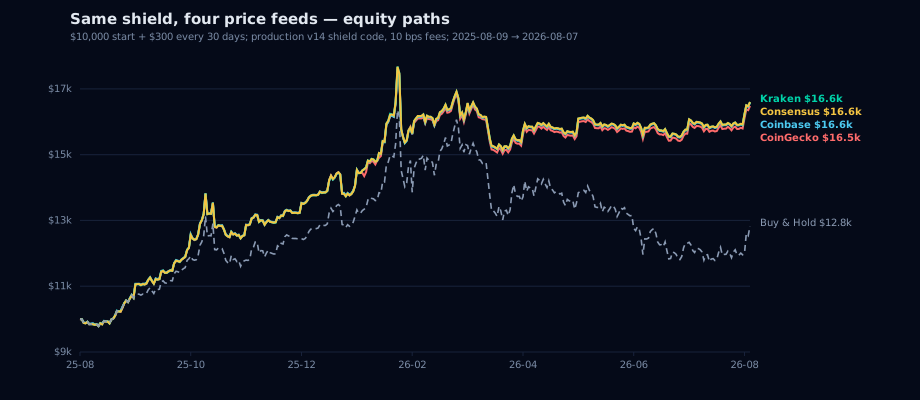
Equity per feed arm, same shield code. The Consensus arm mirrors the merge production serves for the triple-sourced tokens; the Aggregator-only arm is the reality of the five single-source tokens. Dashed grey: Buy & Hold.
Buy & Hold on the same window: +28.3–28.4%.
The bottom line is feed-robust in this window. Final values sit inside a 0.7% band, max drawdown inside 0.3 pp. Two structural reasons: the sub-basket is dominated by PAXG (52.6% — the cleanest series in the study, 0 jumps on every feed), and contaminated prints are mean-reverting (a +107% print is followed by a −52% print), so their net effect on level largely cancels.
The basket-level return of the production feed deviated from the consensus by more than 2 pp on 0 of 363 days — the contamination is real but, at these weights, it stays below the basket surface.
6. Where the feed DOES change the signal
Outcome equivalence is not mechanism equivalence. Two channels show movement:
Timing. Shield exposure paths differ by more than 5 percentage points on 6.9% of days (vs Coinbase) and 5.0% (vs Kraken); versus the consensus, 4.7%. Exchange-vs-exchange: 1.4%, and zero days above 10 pp. The production feed makes the shield trade on different days roughly once a fortnight — a bad print spikes the drawdown window, the shield de-risks a day early or re-enters a day late. In this window the net result almost fully cancelled; there is no guarantee it cancels in the next one.
The macro input. The KKT loop re-optimises on realised volatilities and covariances computed from the same daily series. Per-feed annualised vol of the sub-basket tokens:
| Token | Aggregator | Coinbase | Kraken | Spread |
|---|---|---|---|---|
| PAXG | 29.3% | 29.5% | 29.6% | 0.3 pp |
| ATH | 118.9% | 114.5% | 115.5% | 4.4 pp |
| PYTH | 153.5% | 141.5% | 140.9% | 12.6 pp |
| TIA | 292.9% | 106.1% | 105.4% | 187.5 pp |
The production feed estimates TIA's risk at 2.8× the exchange estimate — purely from bad prints. The frozen weights locked 2026-08-08 are untouched by this (they are frozen), but the next macro re-optimisation reads those contaminated vols — and for the five single-source tokens (§2) the contaminated vol is exactly what sits in the production DB, with no second feed to outvote it. Thin tokens get systematically over-penalised, and the "clean" answer depends on which feed you ask. This is the channel where feed choice stops being noise and becomes a hidden parameter.
7. Caveats
- Window: 364 days (2025-08-09 → 2026-08-07), capped by the aggregator's free-tier 365-day history limit. No bear-market leg is covered.
- Sub-basket: only the 4 of 8 plan tokens listed on all three feeds. The replay is gold-heavy by construction; the contaminated single-source tokens (DAG, EWT, PEAQ; ATH is in the replay, TICS is not) could not be replayed across feeds. Their contamination counts in §4 are the evidence for them instead.
- Study series vs production DB: this study pulls the public APIs directly; production reads the merged DB. For TIA/PYTH/PAXG the Consensus arm replicates the pipeline's merge rule (per-date median) on the same three feeds.
- Jump threshold: 30% is a heuristic; genuine thin-token moves can exceed it. The uncorroborated count (requiring silence on BOTH exchanges ±1 day) is the conservative figure used for attribution.
- No lookahead anywhere: every feed arm runs the identical production code path, same DCA, same fees, same constants.
8. Implications
1. Venue disagreement is not the risk. Two independent exchanges agree to within ~0.1% on a typical day. The aggregator agrees with them in the median — the risk lives entirely in its tail. 2. Production's median merge does its job where it has inputs. The consensus arm — the same rule the pipeline applies to TIA/PYTH/PAXG — sits within $22 of the exchange arms' finals, and all four outcomes land inside a 0.7% band with 0/363 days of >2 pp basket-level deviation. 3. The gap is coverage, not math. Five of the eight plan tokens — ATH, DAG, EWT, PEAQ, TICS — reach the production DB through the aggregator alone even though Kraken lists four of them; the 4.5σ outlier filter is the only screen left there, and it is weakest exactly where the token's own volatility is highest. 4. The two exposed channels are timing and the macro vol input, both driven by single-feed bad prints on thin tokens. 5. Candidate hardening (not implemented — shield parameters are frozen and this study changes nothing in production): collect ATH, DAG, EWT and PEAQ with the Kraken collector so the existing median merge gains a second input. Caveat: with two sources the merge takes the higher of the two prices (middle index of the sorted list), so the full benefit needs a third source or an explicit reject rule. TICS stays single-source in any case — it is listed nowhere else — and deserves its own plausibility clamp.
The honest summary: the signal does not depend on who tells you the price in the median case — the pipeline already takes the median. But one of the three feeds occasionally lies, the lie is concentrated in exactly the tokens the plan must hold, five of the eight tokens get no second opinion in production, and the next macro re-optimisation will read those lies as volatility.