← All research|Also available in 中文
Institutional risk report — does Aegis (v14)'s edge survive 3,000 synthetic histories?
Published: 2026-08-07
Simulated results — no real money. Every figure below is computed from historical price data by a backtest. No capital was invested and no orders were placed. Backtests apply a strategy to the past with full knowledge of how that period turned out, and the figures exclude slippage and liquidity effects, though a simulated 0.1% exchange fee is charged on every rebalance, DCA buy and redeployment. Simulated and past performance is not a reliable indicator of future results. AQMath is software, not investment advice.
Date: 2026-08-07
Engine: Aegis (v14) Dual-Speed E2E — identical wiring to the live paper trading service (180-day KKT risk-parity MACRO loop with the ADV-K2 liveness screen + Aegis (v14) Deleverage Shield)
Status: 📊 RESEARCH — Monte Carlo statistical validation, no basket promoted
1. Objective
Every study published so far — the regime autopsy, the robustness grid, the graveyard gauntlet — answers the same family of question: did the system survive this particular history? Funds and banks ask the next question before they allocate: is the edge statistically real, how fat is the tail, and would it survive a correction for all the testing we did to find it?
This study answers with the standard institutional toolkit, applied to the same three baskets used throughout this series (A Majors+Gold, B 2019-20 Gen, C Landmine):
1. Stationary block bootstrap (Politis–White) — 3,000 paired synthetic histories per basket, strategy and buy & hold built from the same resampled path. 2. Deflated Sharpe Ratio (Bailey & López de Prado) — the probability the observed Sharpe is not a selection-bias artefact, as a function of the number of trials N that were tried before finding it (N = 1 … 500). 3. White's Reality Check — a recentered bootstrap test of H0: E[strategy − buy & hold] ≤ 0. 4. CVaR(95%) at a one-month (21 trading-day) horizon, pooled over all bootstrapped windows.
Same method as the Robustness study: production macro_reoptimize() and daily_step() imported unmodified, ADV-K2 liveness screen active, $1,000 start + $100/30d DCA, walk-forward, no lookahead, 10 bps fee on every trade.
Two conventions to keep the numbers comparable. All metrics here are time-weighted — computed on the strategy's own daily returns with DCA flows stripped out, which is why the drawdowns read higher than the account-level figures in earlier articles (DCA inflows cushion account equity). The buy & hold benchmark carries the same DCA schedule and the same fees on its buys.
2. The bootstrap: 3,000 lives of the same market
The stationary block bootstrap resamples blocks of consecutive days with geometric block lengths (mean 10 days), so each synthetic path preserves serial correlation, volatility clustering and fat tails — the three properties that make i.i.d. resampling wrong for financial data. For each of the 3,000 paths, both legs (strategy and buy & hold) are evaluated on the identical resampled sequence, so every comparison is paired: the strategy cannot win because it got an easier history.
Observed values and 90% bootstrap confidence intervals:
| Basket | Sharpe S | Sharpe B&H | MDD S | MDD B&H | Calmar S | Calmar B&H |
|---|---|---|---|---|---|---|
| A Majors+Gold | 0.79 [0.10, 1.57] | 0.82 [0.12, 1.74] | 26.3% [17.1, 39.7] | 49.6% [27.1, 60.3] | 0.84 | 0.68 |
| B 2019-20 Gen | −0.08 [−0.68, 0.62] | 0.19 [−0.44, 1.04] | 25.7% [19.6, 54.7] | 46.5% [33.3, 74.8] | 0.13 | 0.26 |
| C Landmine | 1.04 [0.28, 1.92] | 0.85 [0.13, 1.74] | 24.0% [14.4, 32.7] | 39.2% [23.7, 53.5] | 1.03 | 0.81 |
Probability that the strategy beats buy & hold across the 3,000 paths:
| Basket | MDD | Sharpe | Calmar | Final value |
|---|---|---|---|---|
| A | 99.6% | 41.6% | 52.9% | 9.0% |
| B | 98.6% | 9.0% | 23.5% | 18.2% |
| C | 99.7% | 77.0% | 76.3% | 18.8% |
3. What holds: the risk edge is statistically real
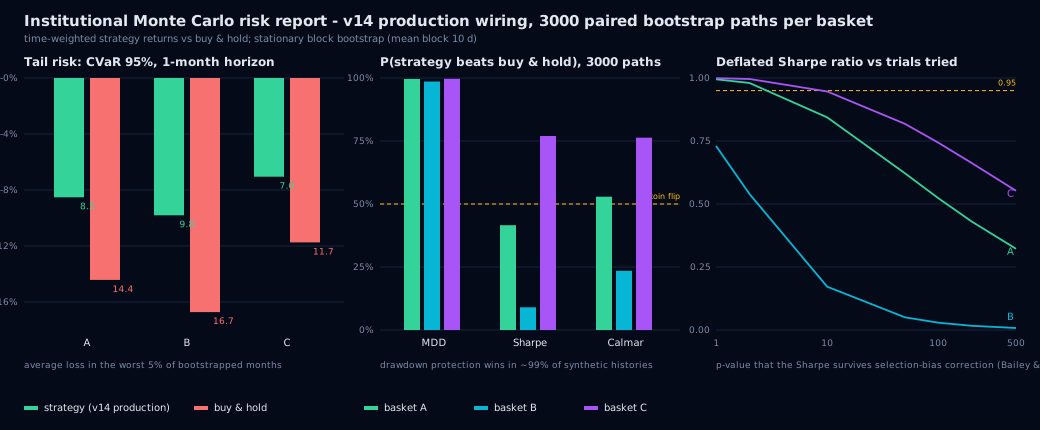
The drawdown cut is the one claim that survives everywhere. Across all 9,000 synthetic paths, the strategy's maximum drawdown is lower than buy & hold's in 98.6–99.7% of them — not a point estimate but a distribution statement, and the confidence-interval bands above show it is not even close: on basket A the strategy's MDD CI90 upper bound (39.7%) sits below buy & hold's median (40.0%).
The tail is thinner by the same margin. At the one-month horizon, CVaR(95%) — the average loss conditional on being in the worst 5% of months — is −8.5% vs −14.4% on A, −9.8% vs −16.7% on B and −7.1% vs −11.7% on C: roughly a 40% shallower tail on every basket, including basket B where every return-based metric fails. The shield's job description is exactly this, and the bootstrap confirms it is not a property of the one history we happened to live through.
Basket C is the strongest case on every dimension: observed Sharpe 1.04 against buy & hold's 0.85, and a 77% probability of a higher Sharpe across synthetic histories.
4. What doesn't hold: excess return over buy & hold
White's Reality Check cannot reject H0 on any basket (p = 0.51 / 0.50 / 0.52): the strategy's excess return over buy & hold is not statistically distinguishable from zero. The final-value win probabilities (9–19%) say the same thing from the retail angle — in the histories where crypto moons, the de-risked portfolio ends below full exposure. That is the price of the drawdown cut, stated plainly.
The Deflated Sharpe Ratio adds the selection-bias correction. If only one configuration had ever been tried (N=1), A's and C's Sharpes clear the bar comfortably (0.99+). Declaring honestly that many configurations were tried in this project's research history erodes the evidence: C stays robust (0.74 at N=100, 0.55 at N=500), A fades to 0.52 at N=100, and B collapses (0.03 at N=100 — its Sharpe is indistinguishable from tuning noise). Basket B remains the honest exception of this series: strong protection, weak returns, at every test we have run.
5. Caveats
- The bootstrap only resamples the past. It shuffles the regimes we already have; it cannot generate a regime that never happened. A truly novel crash is still an open question, which is exactly what the Graveyard Gauntlet attacks from the other side.
- Block length is a modelling choice. Mean block 10 days preserves crash-scale clustering; materially shorter blocks would understate tail risk, materially longer ones would overstate it.
- Time-weighted convention. Figures strip DCA flows; account-level drawdowns published earlier are lower. Both conventions are stated on every page that uses them.
- The benchmark includes DCA and fees on its buys, so the comparison is against an investor who dollar-cost-averages, not against a lump-sum holder.
6. Verdict
The institutional answer is split cleanly in two. The risk case is real: shallower drawdowns and a ~40% thinner one-month tail hold in ~99% of 3,000 synthetic histories per basket, and basket C's Sharpe survives a generous selection-bias correction. The return case is not: no basket shows statistically significant excess return over buy & hold, and we publish that rather than bury it. The system being sold here is risk management, not alpha — and this is the test that says so with numbers.
Simulated on historical daily closes with fees; nothing here is financial advice.