← All research|Also available in 中文
How AQMath Solves Real Problems in Crypto — Tested Against Buy & Hold
Published: 2026-09-21
Simulated results — no real money. Every figure below is computed from historical price data by a backtest. No capital was invested and no orders were placed. Backtests apply a strategy to the past with full knowledge of how that period turned out, and the figures exclude slippage and liquidity effects, though a simulated 0.1% exchange fee is charged on every rebalance, DCA buy and redeployment. Simulated and past performance is not a reliable indicator of future results. AQMath is software, not investment advice.
Date: 2026-09-21
Engine: Proteus (v18) production macro loop — the 180-day KKT risk-parity weighter plus the volatility-scaled Deleverage Shield, run unmodified on default_config()
Status: 📊 RESEARCH — measured on the production path. This is a risk-control result, not a return claim.
1. The problems, and the honest thesis
Crypto does four things to a portfolio that a plain "buy and hold" does not solve:
1. It crashes violently. A basket of majors can lose well over half its value in a single drawdown and take years to recover. 2. It is hard to size. Eight wildly different volatile assets are not a 1/8-th-each problem; the naive split lets the most unstable coins dominate the risk. 3. It punishes indecision and panic. Most of the damage people take is behavioural — selling the trough, freezing at the top, skipping the buys. 4. Tokens die. A name that quietly disappears can keep a real allocation for months if nobody is watching.
AQMath's answers are its frozen 180-day KKT risk-parity weights (problem 2), the daily volatility-scaled Deleverage Shield (problem 1), a disciplined DCA-and-rebalance cadence (problem 3), and — covered in the dedicated liveness-screen study — an activity filter (problem 4).
The thesis, stated up front so the tables cannot be misread: AQMath is not a return machine. Its published risk report already showed that the excess return over Buy & Hold is statistically zero; the drawdown cut wins in 98.6–99.7% of synthetic histories. Every test below reproduces that on one real basket: the win is the size of the hole you survive, paid for with some of the upside.
2. How we tested
One basket, one DCA schedule, one fee, the unmodified production code path — compute_equal_weight_returns → compute_macro_weights → apply_macro_weights → simulate_v18. No parameter was tuned to this data.
| Token | Role |
|---|---|
| BTC, ETH | liquid majors |
| SOL | young, high-beta large cap |
| XRP, ADA, LINK, DOGE | large caps |
| PAXG | tokenised gold — the low-volatility in-basket anchor |
| CEL | added only in §6 — collapsed 2022, the dead-token probe |
- Basket: 8 assets — a diversified mix (gold anchor + high-beta SOL + majors) — over the shared window 2020-04-10 → 2026-07-04 (2,275 days, 6.23 y), 12 MACRO re-optimisations, spanning the 2021 blow-off and the 2022 collapse.
- Money: $10,000 start + $300 DCA every 30 days ($32,500 invested on both sides), 0.1% simulated fee on every trade, DCA buy and redeploy.
- Benchmark: a Buy & Hold + DCA reference run on the identical basket and identical DCA stream, so the only difference is the strategy.
- Data: daily CoinGecko closes from a local refresh (2026-07); the shared window is set by the youngest token (SOL, from 2020-04) so the 2022 bear is preserved. Still survivorship-selected large caps — see §7.
3. Problem 1 — Crashes and drawdown control
| Metric | AQMath (Proteus v18) | Buy & Hold + DCA |
|---|---|---|
| Final value | $182,068 | $551,637 |
| Total invested | $32,500 | $32,500 |
| Growth multiple | 5.6× | 17.0× |
| CAGR | +31.9% | +57.6% |
| Max drawdown | 27.1% | 57.3% |
| Sharpe (rf 5%) | 0.78 | 0.89 |
| Calmar | 1.18 | 1.00 |
| Defensive days | 1,519 (67%) | — |
| Avg risky exposure | 43% | 100% |
| Trading fees | $4,454 | — |
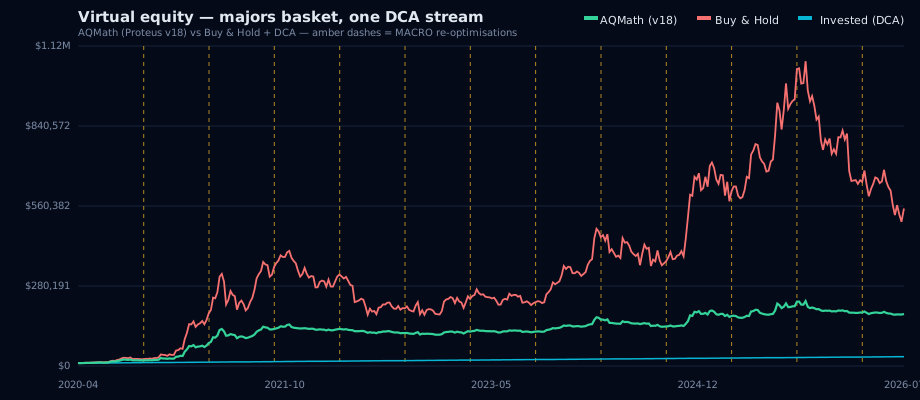
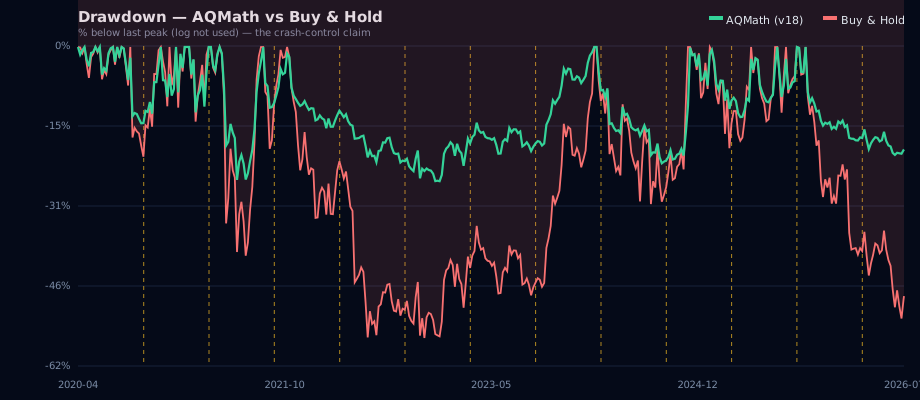
Reading: this is the whole case in one row. AQMath cut the worst drop from 57.3% to 27.1% — a 30-point reduction — roughly halving the hole a holder has to sit through. It did that by averaging only 43% market exposure, and it wins on the drawdown-scaled measure (Calmar 1.18 vs 1.00). It does not win on raw Sharpe here (0.78 vs 0.89): in a window dominated by the 2020–21 melt-up, Buy & Hold's full exposure rode a smoother climb, while AQMath's in-and-out of risk adds its own variance. And the protection is paid for in absolute dollars — Buy & Hold finished at $552k against AQMath's $182k. Staying fully invested won on return and on Sharpe, and lost on the size of the crash — exactly the trade §1 promised.
The earlier Aegis (v14) shield on the same basket and path cut marginally deeper still — 24.9% MaxDD, Calmar 1.32 — a fair note given v18 is the live engine: v18's edge over v14 is a modest, honestly-caveated improvement measured across 182 unseen baskets (OOS validation), and on this particular set v14's slower re-risk happened to serve the window slightly better.
Virtual equity — AQMath vs Buy & Hold + DCA (identical DCA stream, amber dashes = scheduled MACRO re-optimisations):
Drawdown — the 57.3% hole vs the 27.1% hole:
4. Problem 2 — Risk-balanced allocation (KKT vs equal weight)
Stripping the shield away and holding each weighting with a single purchase of $1 isolates the allocation layer itself. On this diversified basket the KKT weighter is no longer a rounding error — it wins on all four measures:
| Metric | KKT risk-parity | Equal weight (1/8) |
|---|---|---|
| Terminal (per $1) | $45.67 | $37.86 |
| CAGR | +84.7% | +79.2% |
| Max drawdown | 58.0% | 76.3% |
| Sharpe | 1.34 | 1.06 |
| Calmar | 1.46 | 1.04 |
That is an 18.3-point drawdown cut and a higher terminal value from the weighting alone, before any shield. The reason it finally shows teeth is that the objective is not a formula in disguise: the frozen KKT weights on the final re-optimisation ranged from 0% to 29.2%, nowhere near the flat 12.5%:
| Asset | PAXG | BTC | XRP | LINK | ETH | ADA | SOL | DOGE |
|---|---|---|---|---|---|---|---|---|
| KKT weight | 29.2% | 18.7% | 17.3% | 10.8% | 9.5% | 7.6% | 7.0% | 0.0% |
The gold anchor PAXG — the lowest-volatility name in the book — was loaded up to 29.2%, more than double its equal weight, while the meme coin DOGE was zero-weighted and hyper-beta SOL trimmed to a token 7%. That is risk-parity doing portfolio construction: lean on the stable asset, refuse the erratic one. An equal-weight basket cannot — it holds DOGE and PAXG at the same 12.5% by definition. (The qualitative "optimizer refuses the risky name" pattern also shows up in the E2E TIA/QNT study.)
5. Problem 3 — Discipline (rebalance + DCA)
AQMath is a signal-only rebalancer: it never trades for you, so the discipline is a cadence you follow, not an autonomous bot. The design bakes the two behavioural fixes straight into the protocol:
- Same DCA both sides: 75 scheduled $300 buys over the window, charged a 0.1% fee each — the benchmark is not a strawman, it is dollar-cost-averaging faithfully executed.
- 301 threshold rebalances and 67% defensive days: when the shield goes to cash, new DCA parks in USDC and redeploys as one tranche on re-risk, so the routine keeps running instead of freezing in a drawdown.
The behavioural case is already published: DCA jitter costs at most 0.5 pp of MaxDD and only same-day execution passes (human-factor stress test); and across 30 simulated people, zero held a static 60/40 plan — every one capitulated 3–5 times (static vs dynamic). This study is not a fresh test of the human behaviour; it is the mechanical cadence that the stress tests reward.
6. Problem 4 — Dead-token safety
Adding Celsius (CEL) to the same basket — same shared window 2020-04-10 → 2026-07-04 (6.23 y), running straight through the 2021 peak and the 2022 collapse:
| Metric | AQMath (Proteus v18) | Buy & Hold + DCA |
|---|---|---|
| Final value | $357,888 | $978,839 |
| Max drawdown | 32.1% | 68.6% |
| Sharpe | 1.16 | 1.03 |
| Calmar | 1.46 | 1.06 |
The shield held the drawdown to 32.1% against 68.6% (−36.5 pp) even with a collapsing asset in the book, and on this window it also wins on both Sharpe and Calmar — CEL finished at roughly a sixth of its first-day price. The run still reproduces the flaw honestly: in CEL's first year inside the window the frozen KKT loop handed it a 12.2% weight (day 180) before the collapse zeroed it, because a delisting chart can look low-volatility to a pure price-variance objective. That is exactly the dead-token weight flaw the liveness-screen study reproduces and fixes with the ADV-K2 cap-zero filter, and the slow-vs-fast death attribution in the graveyard gauntlet. The raw macro loop helps; the shipped screen is what closes it.
7. What this does not claim
- Not a return edge. Buy & Hold finished far higher in absolute terms on this window; AQMath's case is drawdown and risk-adjusted survival, consistent with the statistically-zero excess return in mc-risk.
- A friendlier window, a softer basket. 2020–2026 large caps are survivorship-selected, and this basket deliberately includes a gold anchor (PAXG) plus a diversified mix rather than an all-crypto max-beta book — so both sides start from a lower drawdown than a pure crypto basket. The comparison stays fair because AQMath and the benchmark hold the same eight names; the protection looks expensive precisely because this slice of the bull was strong. The crash-regime cuts in regime-autopsy are where the same machinery earns its keep.
- Simulated, single basket, one DCA setting. No slippage or liquidity, a 0.1% fee, one 8-asset basket. Robustness of the knobs is a separate study (129 walk-forward re-runs).
8. Reproducibility
Production path, default_config() (risk budget 0.95, 10 bps fee, 180-day MACRO interval and lookback). The harness imports compute_equal_weight_returns, compute_macro_weights, apply_macro_weights, simulate_v18 and calc_metrics unmodified and writes both SVGs straight from the resulting equity / drawdown arrays:
`` python scratch/crypto_problems_bench_2026.py ``
Basket, DCA and fee presets are at the top of the script. The harness is a git-ignored analysis file and is never imported by main.py.
Simulated results — no real money. Every figure is computed from historical price data by a backtest; no capital was invested and no orders were placed. Figures exclude slippage and liquidity effects, though a simulated 0.1% fee is charged on every trade. Simulated and past performance is not a reliable indicator of future results. AQMath is software, not investment advice.